Thursday, December 17, 2015

AMETEK, Inc (AME)

Seriously, I am not stalking Lou Simpson at all (or at least any more than any other 'great' investor).  But this sort of jumped out at me.  It's sort of old news as the 13-F's came out in November.

Sometimes, some investors just buy or own stuff that just resonates with me, like that time Nehal Chopra of Ratan Capital was on CNBC talking about Post Holdings and Charter Communcations.  I owned (and still own) both of them.  Apparently, Chopra dumped POST when it tanked but bought back recently.  I rode it all the way down without selling anything and am nicely in-the-money on it now.

At the time, I had no idea who Chopra was.

This is sometimes why I post about certain investors.  If they do something that interests me, I will make a post about it.  And if it happens three times in a row, well, so be it.  Surely, other investors have made more interesting buys recently.  This is just what jumps out at me.  By the way, I don't own BAM, SCHW or AME.

Anyway, AMETEK (AME) has been mentioned here in the past (by readers) as an outsider-CEO-type company; growing through acquisitions etc.  Maybe you can call it a DHR-like company.  I guess "outsider-CEO-like company" might not sound so great now after VRX, but whatever.

And by the way, I know it's been a while since I posted.  I never make a post and then say, OK, I'm going to take a break for a month or two from blogging.  It's just that time passes and then it's like, wow, I haven't posted in more than a month!  Well, all sorts of things happen, some travelling, obsession with other things etc.  But my main thing is still investing; it's just that sometimes time flies without me having made a post even when some ideas pop up (and I never bother to make the post for one reason or another).

Simpson Buys Big
So check this out.  Simpson had no AME shares earlier this year (and never showed up in any 13-F for SQ Advisors recently).

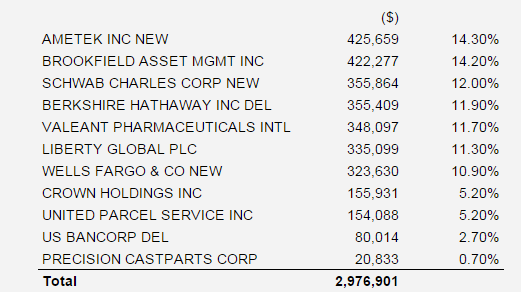
Number of shares of AME in SQ Advisors' 13-F:

3/31/2015:   0
6/31/2015:  1.8 million
9/31/2015:  8.1 million

So that's kind of huge.   The 13-F as of September-end showed $3.0 billion in U.S. stocks, and more than 14% of the portfolio in AME (this excludes cash and other assets that are not U.S. listed stocks).

Lou Simpson Portfolio


My last couple of posts related to Simpson were about BAM and SCHW, and AME is even bigger than those.  It's also interesting that Simpson added to VRX in September, but this was before the real crash in the stock.  I wonder what he did after that. It is interesting how Munger can really despise this company and Simpson can like it enough to make it such a large holding (he has owned it since (at least) 2011 and actually owns more shares now than in 2011; 2 million shares as of September 2015 versus 1.2 million back in 2011).


AME
AME has been run by Frank Hermance (now aged 66 or so) since 1999.  He became President and CEO in September 1999 and Chairman and CEO in January 2001.   AME aims to double the size and profitability of the company every five years.  1/2 to 2/3 of their growth is to come from acquisitions.

From their 10-K, this is what they do:
Products and Services     AMETEK’s products are marketed and sold worldwide through two operating groups: Electronic Instruments (“EIG”) and Electromechanical (“EMG”). Electronic Instruments is a leader in the design and manufacture of advanced instruments for the process, aerospace, power and industrial markets. Electromechanical is a differentiated supplier of electrical interconnects, precision motion control solutions, specialty metals, thermal management systems, and floor care and specialty motors. Its end markets include aerospace and defense, medical, factory automation, mass transit, petrochemical and other industrial markets.

Competitive Strengths 
Management believes AMETEK has significant competitive advantages that help strengthen and sustain its market positions. Those advantages include: 
Significant Market Share.    AMETEK maintains significant market shares in a number of targeted niche markets through its ability to produce and deliver high-quality products at competitive prices. EIG has significant market positions in niche segments of the process, aerospace, power and industrial instrument markets. EMG holds significant positions in niche segments of the aerospace and defense, precision motion control, factory automation, robotics, medical and mass transit markets. 
Technological and Development Capabilities.    AMETEK believes it has certain technological advantages over its competitors that allow it to maintain its leading market positions. Historically, it has demonstrated an ability to develop innovative new products that anticipate customer needs and to bring them to market successfully. It has consistently added to its investment in research, development and engineering and improved its new product development efforts with the adoption of Design for Six Sigma and Value Analysis/Value Engineering methodologies. These have improved the pace and quality of product innovation and resulted in the introduction of a steady stream of new products across all of AMETEK’s lines of business. 
Efficient and Low-Cost Manufacturing Operations.    Through its Operational Excellence initiatives, AMETEK has established a lean manufacturing platform for its businesses. In its effort to achieve best-cost manufacturing, AMETEK has relocated manufacturing and expanded plants in Brazil, China, the Czech Republic, Malaysia, Mexico, and Serbia. These plants offer proximity to customers and provide opportunities for increasing international sales. Acquisitions also have allowed AMETEK to reduce costs and achieve operating synergies by consolidating operations, product lines and distribution channels, benefitting both of AMETEK’s operating groups. 
Experienced Management Team.    Another component of AMETEK’s success is the strength of its management team and that team’s commitment to improving Company performance. AMETEK senior management has extensive industry experience and an average of approximately 23 years of AMETEK service. The management team is focused on achieving results, building stockholder value and continually growing AMETEK. Individual performance is tied to financial results through Company-established stock ownership guidelines and equity incentive programs.

Business Strategy 
AMETEK is committed to achieving earnings growth through the successful implementation of a Corporate Growth Plan. The goal of that plan is double-digit annual percentage growth in earnings per share over the business cycle and a superior return on total capital. In addition, other financial initiatives have or may be undertaken, including public and private debt or equity issuance, bank debt refinancing, local financing in certain foreign countries and share repurchases. 
AMETEK’s Corporate Growth Plan consists of four key strategies: 
Operational Excellence.    Operational Excellence is AMETEK’s cornerstone strategy for improving profit margins and strengthening its competitive position across its businesses. Operational Excellence focuses on cost reductions, improvements in operating efficiencies and sustainable practices. It emphasizes team building and a participative management culture. AMETEK’s Operational Excellence strategies include lean manufacturing, global sourcing, Design for Six Sigma and Value Engineering/Value Analysis. Each plays an important role in improving efficiency, enhancing the pace and quality of innovation and cost reduction. Operational Excellence initiatives have yielded lower operating and administrative costs, shortened manufacturing cycle times, higher cash flow from operations and increased customer satisfaction. It also has played a key role in achieving synergies from newly acquired companies. 
Strategic Acquisitions.    Acquisitions are a key to achieving the goals of AMETEK’s Corporate Growth Plan. Since the beginning of 2010 through December 31, 2014, AMETEK has completed 26 acquisitions with annualized sales totaling approximately $1.4 billion, including five acquisitions in 2014 (see “Recent Acquisitions”). AMETEK targets companies that offer the right strategic, technical and cultural fit. It seeks to acquire businesses in adjacent markets with complementary products and technologies. It also looks for businesses that provide attractive growth opportunities, often in new and emerging markets. Through these and prior acquisitions, AMETEK’s management team has developed considerable skill in identifying, acquiring and integrating new businesses. As it has executed its acquisition strategy, AMETEK’s mix of businesses has shifted toward those that are more highly differentiated and, therefore, offer better opportunities for growth and profitability. 
Global & Market Expansion.    AMETEK has experienced dramatic growth outside the United States, reflecting an expanding international customer base and the attractive growth potential of its businesses in overseas markets. Its largest presence outside the United States is in Europe, where it has operations in the United Kingdom, Germany, France, Denmark, Italy, the Czech Republic, Serbia, Romania, Austria, Switzerland and the Netherlands. While Europe remains its largest overseas market, AMETEK has pursued growth opportunities worldwide, especially in key emerging markets. It has grown sales in Latin America and Asia by building, acquiring and expanding manufacturing facilities in Reynosa, Mexico; Sao Paulo, Brazil; Shanghai, China; and Penang, Malaysia. AMETEK also has expanded its sales and service capabilities in China and enhanced its sales presence and engineering capabilities in India. Elsewhere in Asia and in the Middle East, it has expanded sales, service and technical support. Recently acquired businesses have further added to AMETEK’s international presence. In recent years, AMETEK has acquired businesses with plants in Germany, Switzerland, the United Kingdom, Serbia and China as well as acquired domestically located businesses that derive a substantial portion of their revenues from global markets. 
New Products.    New products are essential to AMETEK’s long-term growth. As a result, AMETEK has maintained a consistent investment in new product development and engineering. In 2014, AMETEK added to its highly differentiated product portfolio with a range of new products across each of its businesses. 

And from the annual report, a snapshot:


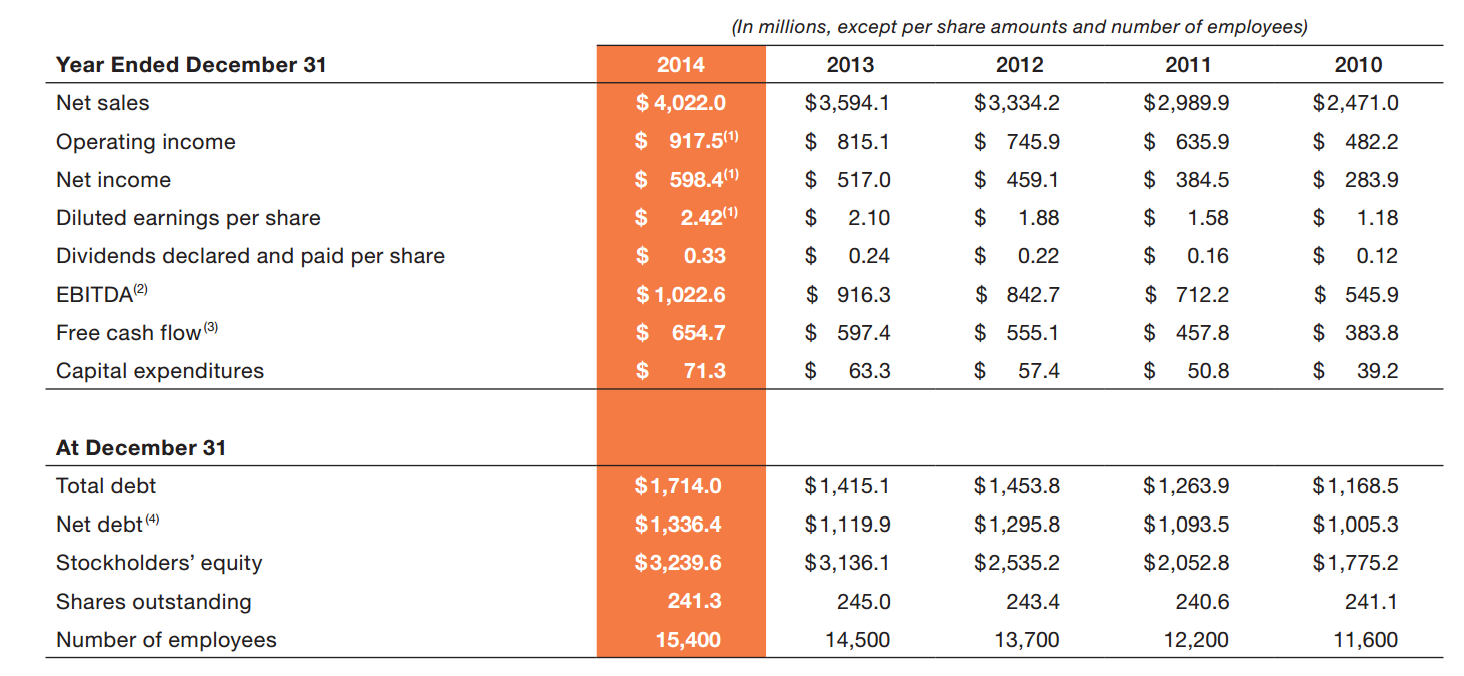
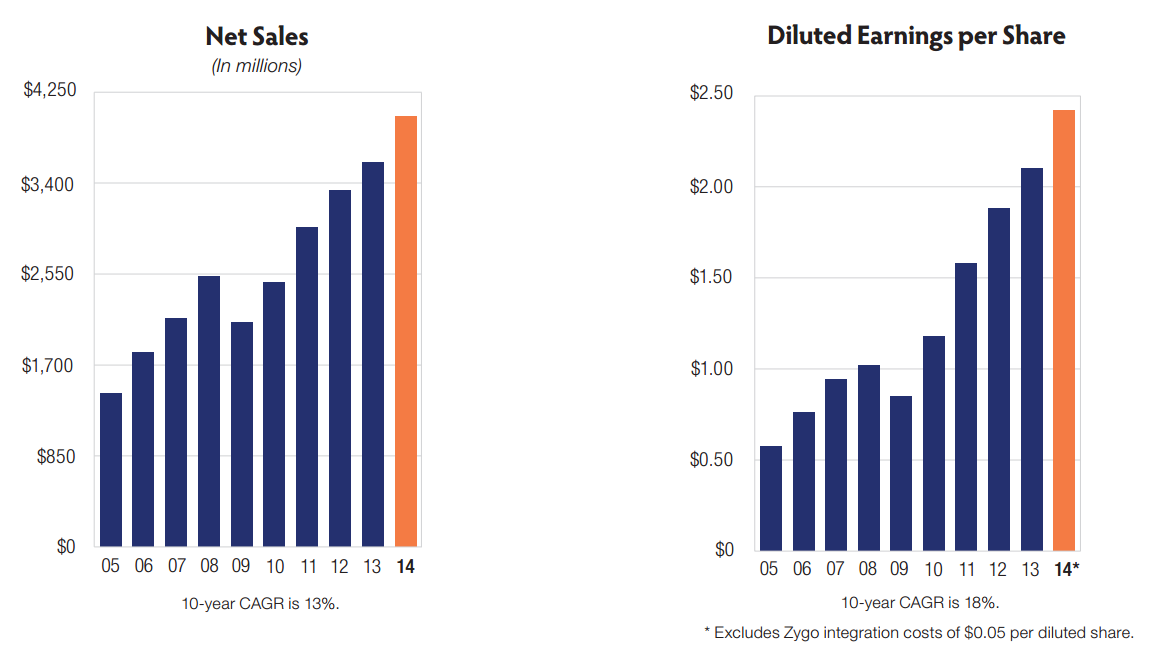
It looks pretty impressive. Nice growth, and new highs after the 2008/2009 recession pretty quickly.  I dug up some figures going back to 1999 when Hermance became CEO to see how he has done, and it is pretty impressive:

Financial Summary of AME since 1999

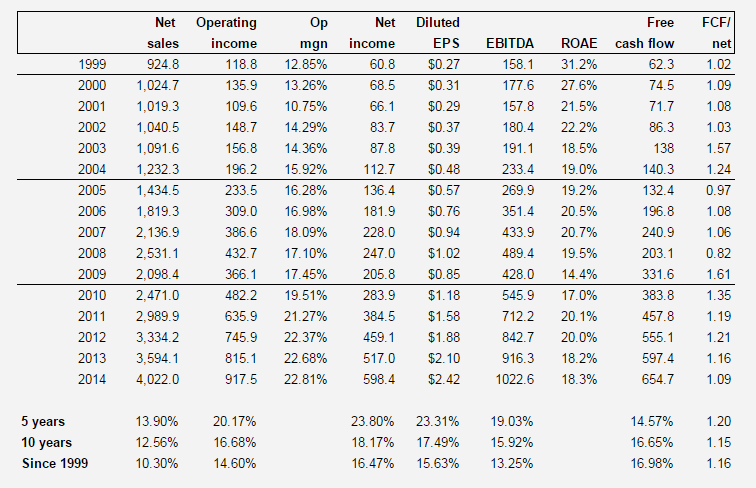
Net sales grew 10%/year since 1999 while operating income grew around 15%/year, and EPS around 16%/year.

As with DHR, free cash flow has been higher than net income throughout the period by around 1.2x.

The interesting thing about AME is that these figures are not "adjusted" or anything like that.  Unlike, say, VLX, AME's EPS is plain EPS.

As of the third quarter, guidance for the full year 2015 was $2.55/share, up 5% over 2014.  With the stock at around $54/share, it's trading at a P/E of around 21x.

Conclusion
AME does seem to be facing some macro headwinds.  Oil and gas hasn't been too much of an issue as they don't have that much exposure to upstream, but slowing growth in Asia and emerging markets are holding back their growth this year and probably into next year.  So there is some risk there.

The stock is certainly not for cheapskates at 21x P/E, but they do have good free cash flow conversion and growth potential.  Their operating margins are higher than say, DHR or CFX too (with similar business models).   AME isn't leveraged at all, either, with long term debt of $1.6 billion against 2014 EBITDA of $1 billion.  With the junk bond market tanking and rates going up, this may be a good thing.

There are plenty of 20+ P/E stocks with very little growth prospects (and the whole market at close to 22x P/E), maybe this is not a bad idea.  Historically, AME has traded at around 20x P/E.


Sunday, October 4, 2015

Superinvestor Portfolio Winners and Losers

This is sort of just an administrative post:  I added to the 'pages' section a winners and losers sort of the Superinvestor portfolios.  This, I guess, is the companion to the Superinvestor screens.

It's just sorts the stocks in the portfolio by year-to-date returns.

I'm guessing with all of the volatility in the markets these days, this would make an interesting browse for some people.  

This is all just part of my recent hobby (coding), so I am doing this for fun; to see what it feels like to actually get some coding stuff into 'production', and see if I can make it as automated as possible so I don't have to do anything etc.

Superinvestor Portfolio Winners and Losers

Monday, September 28, 2015

12% Dividend Yield?! (Och-Ziff Capital Management Group (OZM))

The alternative management companies have been getting crushed in the recent correction.  A lot of these guys were trading 'cheap' to begin with so I was wondering if there was some opportunity here.  I've talked about some of these in the past, but other than OAK, have not invested in any of them.

That's mostly because I thought there was an alternative asset bubble and I wasn't that excited about prospective returns from some of these guys who have grown their assets so quickly in the past few years.  Every presentation you look at, you see these alternative managers growing AUM at a double digit clip.  And then you have to wonder, all of these guys at some point have to fish in a smaller and smaller pond (as their asset base gets bigger, they have to pursue bigger deals).  What will happen to returns when so many giants are chasing the same, small number of fish?

I sort of still feel this way, but Och-Ziff Capital Management (OZM) caught my attention because I've always liked their approach and mix of strategies.  I was sort of surprised to see that they are diversifying into real estate and credit.  OZM is not really completely market neutral, but they are known for hedged strategies in equities; risk arbitrage, convertible arbitrage, equity long/short etc.  So that is sort of the appeal at OZM; they are not bull market dependent, and they outperform in down markets.

Adding real estate and credit makes them less so, even though Och has said in a conference call that he doesn't think that is the case.  Well, for a while if you are doing only really special situation deals, that is probably true, but as you get bigger in the area, you can't not start to correlate to some extent with the real estate/credit markets.  Plus, I think OZM is concerned with correlation with the S&P 500 index. In that sense, yes, adding credit and real estate may not increase correlation to the index (except in bear markets/crashes when everything goes down!).

12% Dividend Yield?!
Anyway, what hit my radar is that OZM is now trading at around $8.60/share, and their dividends for the past twelve months is $1.03/share; that's a 12% dividend yield.  That certainly looks appealing in this market.

Since 2008, dividends average around $0.91/share, so OZM is trading at a 10.6% yield to average dividends since 2008.  Again, looks good.

Returns at OZM's Master fund wasn't that inspiring at 5.5% net last year.  I think investors expect (or used to) 10%.  I hope OZM still shoots for double digit returns.  In 2013 when the fund returned 13.9%, dividends were $1.79/share.   If OZM had a similar year again, that's a potential 21% dividend yield (but read on before getting too excited).   Anyway, if we normalize earnings for a 10% return we can figure out what normalized earnings would be going forward.

As of the end of June 2015, OZM had AUM of $48 billion.  Their management fees as a percentage of average assets (using the average of beginning of the year and end of year AUM) averaged around 1.6% since 2003.  But their growth in credit in real estate has caused that to come down some.  The average management fee in 2Q2015 was 1.42%.  So let's just use 1.4% for now.

Management fee with $48 billion in AUM gives us $672 million in revenues. 20% incentive fees on 10% return would give us $960 million in incentive fees and total revenues of $1.6 billion.   Economic income margins have averaged around 67% since 2003, but more like 61% since the IPO.  In good years, like 2013, the margin would be higher (67%) due to higher incentive fee income, and in so-so years like 2014, lower (60%).

So let's use 60% economic income margin to be conservative.  That gives us $960 million in economic income.  Using a 20% tax rate (average of last three years), that gets us to distributable income of around $770 million.  With 516 million shares outstanding (using average adjusted shares outstanding for 2Q15), that's $1.50/share in distributable income.  Since OZM tends to pay out most of their distributable income, that would be a 17% dividend yield on a normalized basis.

Pretty nice, and conservative too.

But Wait!!
So my first pass at looking at this was kind of exciting.  But then I realized it's not so simple.  I noticed that their cash bonuses tends to be around 20% of total revenues every year, and that sounded a bit low.  As most of us know, at these alternative asset managers, anything from 40-60% of incentive income is actually paid out to the fund managers.

OZM earned around $1 billion in incentive fees in 2013, but only paid $316 million in cash bonuses.  This includes bonuses for non-investment managers, so seems a little low for an alternative manager.

But look at what's not included in the economic income calculation:  in 2013, OZM granted 12,470,271 RSU's and 24,097,722 Group A Units at fair values of around $10.00 at the time of grant.   That's $366 million of pay to employees that doesn't hit the economic income line.  So the economic income margin is sort of bogus.

Total bonuses are more like $682 million, which comes to 42% of total revenues and 63% of incentive income. That makes more sense.

Total Share Count
Of course, we don't have to look at all that to realize this.  All you need to do is track the total shares outstanding over time to see what's going on.  I won't get into the details of the various share classes; I'll just focus on what OZM calls the adjusted class A shares.

These are the weighted average outstanding for the respective years:

            million shares
2008   400
2009   404
2010   410
2011   419
2012   455
2013   482
2014   509

Over the past six years, shares outstanding have grown 4%/year.   The above dividends per share already accounts for the growing number of shares outstanding so you don't have to deduct 4% from the 10% dividend yield.

In 2013, around 37 million shares were granted (RSU and Group A units) at a fair value of around $10.00.  Let's say they repurchased those shares at the grant-date fair value to keep shares outstanding flat for 2013.  This would have cost $370 million.   Distributable earnings in 2013 were around $900 million.  Instead of paying out dividends, if $370 million was used to repurchase shares, distributable earnings would go down to $530 million.  If we use the 455 million shares outstanding of 2012 (since this is the weighted average for the year, it would be higher for full year 2013 even if they granted no new shares), that would get us to distributable earnings per share of $1.16/share.

So, if OZM has another great year like 2013, that would give us an actual yield of 13.5% ($1.16/$8.60).  Not bad at all, but not the 20% we saw above.

2014 wasn't a great year in terms of returns (+5.5% net for the main fund), but not bad on an AUM growth basis.  One can argue a $1.07/share dividend in a so-so year on a $8.60/share stock price is not bad at all; a 12.4% yield.   Last year only 10 million RSU's were granted (and no Group A Units), so adjusting this would only reduce the possible dividend to $0.95/share or so, for a not so bad 11% yield.

Normalized @ 10% Return
Let's go back to my above example and normalize distributable earnings with a 10% return for OZM's funds.  Using AUM of $48 billion, management fee rate of 1.4%, 10% return on the funds and a 20% incentive fee rate, we got total revenues of $1.6 billion.  We then used an economic income margin of 60% for economic income of $960 million, and then a 20% tax rate to get to $770 million in distributable income.

But this figure excludes stock compensation expense.  I don't really care if it is included in earnings or not; if we want to assume shares outstanding to stay the same (share repurchase to offset dilution), this would reduce available cash to distribute to shareholders and that's what we sort of want to know.  Who cares what GAAP says, or what the amortization rate on expensing this stuff is.

I don't know the formula for paying out stock compensation, but one of the most consistent ratios is stock compensation expense (my definition, not OZM's) to total economic revenues.  Here, I use stock compensation expense as the total fair value of RSU's and Group A units granted (on grant date).

Looking at that versus total revenue (segment, or economic revenue):

               Fair value of grants / total revenue
2010       11.9%
2011       11.6%
2012       10.4%
2013       22.5%
2014       10.5%

It looks fairly consistent at between 10-12% except for 2013, which was a good year performance-wise.  Well, 2012 was good too.  I'm not sure why 2013 stands out.  There may be a good reason for this, but I couldn't find anything as I went through the conference calls and things like that.

Anyway, I will use 12% stock compensation in my normalized distributable earnings scenario.

So, we got up to $770 million in distributable income.  We know from the above that total revenues is $1.6 billion, so total value of equity grants would be $192 million.  Deduct that from our distributable income gives us real distributable income of $578 million.  With 516 million shares outstanding, that gives us $1.12 in distributable income per share.   That's still around a 13% yield; pretty nice, but not the big upside we thought earlier.

If, however, stock grants go up again, this would be much lower; if they granted stock worth 20% of total revenues, distributable income would drop to $0.87/share for a yield of around 10%.

Oddly enough (or not), there doesn't seem to be a huge difference implying that when OZM does really well, the upside is 'granted' away off the income statement.

Doing all of the above again with 65% economic income margin, we would get $1.24 in normalized distributable income for a 14.4% yield.  This could be lower if more stock was granted (here I only use 12% of revenues as the value of stocks granted).

I may be missing some things here and there. I know there are class D stocks, and to offset the above RSU/Group A Units, there are cancellations and forfeitures.   But it doesn't really change the big picture of what's going on here.

Also, I haven't modeled into the above the longer-term assets under management; some AUM are invested for three to five year terms and incentive fees are realized and booked as revenues at the end of the term.  As of the end of June 2015, there were $16.5 billion (34% of total AUM) of such assets with accrued incentive fees (but not booked as revenues) of $353 million.   I haven't modeled this in the above so actual margins may be higher than I suggest.  But if this has been going on for a while,  the incentive fees would actually be included in the historical figures as some funds may already have come to term (old funds come to term, revenues are recognized etc.); 6% and 17% of longer-term AUM will come to term in 3Q15 and second half of 2015 respectively.

In any case, all of this is very rough as it is tough to model.

OZM Fund Performance
Anyway, OZM is not a bad investment if you like this sort of thing (and I know many do not).  There are the usual concerns of size (can they keep performing as they get bigger?), diversification (Carlyle Group's blunders in hedge funds etc...), strategies getting crowded as alternative funds all seem to be growing their AUMs at rapid rates, perpetual-low-interest-rate-high-valuation-tight-spreads-low-return environment etc...

Anyway, let's look at some earlier performance figures.  OZM really did perform well until recently.
This is from their 2007 10-K and you can see how amazing OZM figures were:

  1 Year3 Years5 YearsStrategy
Inception
Net Annualized Return(1)
  
OZ Master Fund, Ltd.(2)
  11.5%11.7%13.9%16.5%
S&P 500 Index
  5.5%8.6%12.8%11.0%
Correlation of OZ Master Fund, Ltd. to S&P 500 Index(3)
  0.600.600.570.45
Volatility(4)
  
Master Fund Standard Deviation (Annualized)
  3.83.13.35.0
S&P 500 Index Standard Deviation (Annualized)
  9.77.88.614.0
Sharpe Ratio(5)
  
Master Fund
  1.632.303.162.41
S&P 500 Index
  0.010.501.090.47


They outperformed the S&P 500 with low correlation to the market and with much lower volatility.

Here is the AUM growth chart from 2007:


And the most recent 10-k shows this:
Net Annualized Return through December 31, 2014
1 Year
3 Years
5 Years
Since OZ Master
Fund Inception
(January 1, 1998)
Since Och-Ziff
Multi-Strategy
Composite
Inception
(April 1, 1994)
OZ Master Fund Composite(1) 
5.5%
10.3%
7.7%
9.6%
n/a
Och-Ziff Multi-Strategy Composite(2) 
5.5%
10.3%
7.7%
9.6%
12.8%
S&P 500 Index(3) 
13.7%
20.4%
15.5%
6.5%
9.8%
MSCI World Index(3) 
10.4%
18.5%
11.8%
5.6%
7.4%
Volatility - Standard Deviation (Annualized)(4)
OZ Master Fund Composite(1) 
5.0%
3.6%
3.8%
4.9%
n/a
Och-Ziff Multi-Strategy Composite(2) 
5.0%
3.6%
3.8%
4.9%
5.4%
S&P 500 Index(3) 
8.3%
9.1%
13.0%
15.6%
15.0%
MSCI World Index(3) 
7.2%
8.9%
11.9%
14.7%
14.1%
Sharpe Ratio(5)
OZ Master Fund Composite(1) 
1.08
2.82
1.99
1.42
n/a
Och-Ziff Multi-Strategy Composite(2) 
1.08
2.82
1.99
1.42
1.80
S&P 500 Index(3) 
1.64
2.22
1.17
0.25
0.44
MSCI World Index(3) 
1.43
2.07
0.97
0.20
0.30
_______________


Not so exciting anymore.  And the AUM chart looks like this:


Here's a table that shows yearly returns for OZM's fund going back to 1994.  You can see that a lot of the high returns were achieved in the early years.  Look at those returns from 1994-2000!  And when the market tanked after the internet bubble, they did pretty well preserving capital.

But since 2000, OZM only returned around 6%/year, but that's still better than the 4%/year of the S&P 500 index (total return).  Since the 2007 peak (to look at 'through-cycle' performance), OZM returned around 6%/year versus the 7.3%/year for the S&P 500 index.


OZM fundS&P500
199428.50%5.30%
199523.50%27.40%
199627.40%23.00%
199726.70%33.40%
199811.10%28.60%
199918.80%21.00%
200020.60%-9.10%
20016.30%-11.90%
2002-1.60%-22.10%
200324.00%28.70%
200411.10%10.90%
20058.80%4.90%
200614.80%15.80%
200711.50%5.50%
2008-15.90%-37.00%
200923.10%26.50%
20108.50%15.10%
2011-0.50%2.10%
201211.60%16.00%
201313.90%32.40%
20145.50%13.70%
5 year avg7.68%15.46%
10 year avg7.64%7.68%
Since 199412.68%9.24%
Since 20005.97%3.86%
Since 20075.95%7.28%


Low Returns
It seems like they had great returns back in the old days when they had AUM under $10 billion,  They got their AUM over $10 billion in 2004, and since then their return has been around 7.6%/year.

Part of it is no doubt due to size; when you are bigger, you can't capitalize on the smaller opportunities.  There is no doubt about that regardless of what anybody says.   The bigger you get, the smaller the opportunity set.  If you find smaller ideas, you still have to find more of them.

Some of this is also due to the low interest rate environment post-crisis and the rush of investment capital into alternatives that serve to tighten spreads and lower returns.

I don't know how much of recent returns are due to each of these factors, so it's hard to tell how things will unfold going forward.

But I do like the strategy mix, at least of the main strategies (excluding credit/real estate).  Those strategies are typical of the pre-Dodd/Frank equity proprietary trading desks at the investment banks. They don't involve forecasting/guessing about the markets, economy or anything like that.  They are usually spread trades (risk arbitrage, convertible arbitrage etc...).

It's possible that there is so much capital chasing those deals that returns won't go back to what they were years ago.   But also, a lot of the spread compression is due to lower interest rates (if your carry costs go down, you can obviously pay a higher price in a risk arb trade, for example).

Low Returns in Context
Having said all that, we have to look at this in context.   10-year treasury yields are 2.2%, the earnings yield on the S&P 500 index is around 5%, and the expected return in stocks using Buffett's old metric is 6.2% or so (he has said more than once that expected returns in stocks is the dividend yield plus inflation plus real economic growth rate:  2.2% dividend yield + 2.0% real GDP growth + 2.0% inflation = 6.2% expected return for stocks).

6-8% returns for OZM funds in this environment is not bad at all.  Keep in mind their low beta on the downside; the stock market might have 5-6% prospective returns, bonds might yield 2.2%, but the stock market can have painful bear markets and if interest rates go up, losses in bonds can be pretty painful too.  OZM has shown that in down markets they outperform handily.

So one can ask, is it better to expect 6-8% returns from OZM funds with some downside protection, or should we go with 5-6% expected returns in the stock market with the inevitable, occasional 50% drawdowns?  Or should we invest in bonds for a 2.2% yield and a possible bloodbath when rates start to rise?  Or should we sit on 0% interest rates until the Fed really normalizes?

None of this is my opinion; just the possible thought process of an investor in OZM funds.

When you look at it like this, the low returns don't look so bad.  Also, there is the optionality to the upside. When markets return to a more chaotic environment (instead of the low volatility environment we've seen post-crisis), spreads may widen, opportunities increase and returns can improve.

In that sense, OZM funds don't look so bad at all.

Or you can take a look at OZM itself and shoot for 10% returns (but with the above-stated risks).

Conclusion
Well, I don't really have a conclusion here. It's certainly interesting and cheap.  OZM is a really great shop as far as I know, and I like the mix of their strategies.  But the two issues are the lower recent returns and the ongoing dilution that seems to really dampen the upside; if OZM has a great year, who knows how many RSU's and Group A units they will grant to their employees?

On the other hand, it looks like OZM yields 10%+ whether they do really well or have a so-so performance year like last year.

So would you be better off investing in OZM for that 10+% yield instead of the 6-7% return in the OZM funds?  Of course this would not be practical for large institutions, or investors who have a large portion of their net worth tied up in the funds.

Normalizing interest rates (which look more and more further out every day), like with so many other financials, will certainly help OZM as spreads will no doubt widen in the various strategies.

Other alternative managers are getting really cheap now too so I will be taking a look at those over the next few weeks.

Stephen Schwarzman of Blackstone (BX) has been frustrated with a cheap stock price for a long time now, and it's just getting cheaper.  BX is sort of the gold standard in private equity.  Schwarzman says that Wall Street doesn't get it, that BX is like LeBron James.  But what investors fear is that BX is like LeBron James, but that every time he scores, the ball gets a little bit bigger so each prospective point gets harder and harder.

There is no doubt that things are getting cheap in the sector.

If there is a credit event (Glencore bankruptcy?), though, financials can all get hit hard as nobody will really know who is holding the bag so one would have to be cautious.

Private equity needs a good credit market and good 'exit' market.  But of course, these things go through cycles and without bad times, they won't be able to put big amounts to work for high returns.  The fear is, I suppose, that these stocks get hit really hard in the down cycles.

I do think the good private equity firms will continue to do pretty well through the cycle.  It's how much stomach do you have to sit through the down cycles?  Anyway, maybe I'll look at some of that stuff later.

This is one aspect that interested me with OZM.  They are not private equity, so as long as they retain/increase AUM, they should do well.

I also understand that there is an investigation and that some pension funds are pulling out of hedge funds due to low returns.  These don't overly concern me.  Pension fund investing goes through cycles too.  There was a big boom in hedge fund investing after the crisis, and that is sort of unwinding.  Pension funds are rear-view mirror investors, so what they do doesn't concern me too much.  In fact, I don't mind at all going the other way.