Thursday, April 18, 2013

Newton's Apple

So Apple has fallen below $400 and it seems like most people still talk about how cheap it is. Yes, it does look really cheap.  But others have pointed out that Apple is only cheap if they can maintain their sky-high margins.

I decided to take a quick look at this since I sort of follow Apple and have posted about it before.  I still don't like Apple as a long term hold and am short the stock off and on (I did flip long once after my Apple LEAPs post, but sold out of it deciding that it doesn't make sense to go long a stock I didn't like just because the stub/LEAP idea was interesting).  

Anyway, my views on Apple hasn't changed much (see Apple is No Polaroid).  The JC Penney fiasco (I followed JCP too but fortunately stayed away from the stock as I thought it was 'too hard') sort of reinforces the idea that Jobs was indeed an incredible talent and people who have done well with Jobs may not be able to retain that 'magic' without him.  Of course, this probably has nothing to do with JCP as Ron Johnson was a successful retail executive before going to Apple.  But anyway, that's whole other topic.

Back to Apple.

Apple Looks Cheap
First of all, a quick look at the cheapness of this stock.  As of the end of the last quarter, Apple had $137 billion of cash and marketable securities.  Taking 75% of that (net of taxes), we get $103 billion and with 939 million shares outstanding, that comes to around $110/share in cash and marketable securities.

Analysts estimate that Apple will earn $44/share in the year ended September 2013.  10x that gives us $440 (interest rate income should be deducted from this, but since rates are so low I won't bother).  At 10x that, we get $550/share in total value for Apple.  With Apple trading at $400/share, that would be a 30% discount to what it's worth.

Margins
One of the keys in the Apple story is the margin.  Can this be sustained?  Of course, what Apple comes out with next is the big story for the long term of Apple; if they can't keep coming up with hit products like the iPod / iPhone / iPad, then Apple is not worth anywhere near what it is today.

But never mind that for a second.  Let's just look at what they have now.  In 2012, their gross margin was 43.9% and their operating margin was 35.3%.

People say that this can't be maintained as their competitors operate with half those margins.  If the gap between products keep closing, how can the spread in margins be maintained?  I think that by many accounts, the difference between Apple products and others are rapidly shrinking.

Anyway, I think the one big competitor is Samsung.  They do break out sales and operating profits for their mobile segment (IT & Mobile Communications).  This segment in 2012 had operating margins of 18%.

If Apple had operating margins of 18%, how cheap is Apple stock then? 

Analysts predict revenues for the current year to be $181 billion.  18% of that is $32.6 billion.  With a 25% tax rate, net earnings (excluding other income) would be $24.5 billion, or $26/share.  10x that is $260, and adding back the cash and securities from above of $110/share, that gives us a total value of $370/share.

Suddenly, Apple stock at $400/share doesn't look so cheap anymore!

Of course, there is no reason why Apple's operating margin has to go down to 18% right away if ever.  But I do think that the historical tendency in these fluid, fast moving industries is that excess margins get competed away.

So anyway, maybe we can't really compare Apple to Samsung.  They are different beasts, and Apple does in fact own the operating system and the eco-system whereas Samsung only provides the hardware.  This is the tricky part.  We know that software has much higher margins than hardware (look at Dell versus Microsoft, for example).  So maybe Apple will always earn a higher margin.

I figured that Apple always did both, so why not take a look at Apple historically?

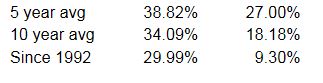
Here is the gross and operating margin history for Apple since 1992 (I can only get data back to 1992):

Historical Apple Margins


So even though Apple did both the hardware and the software, their gross margins were never above 30% until the iPhone era.  Their operating margins were subpar too for most of the period since 1992. 

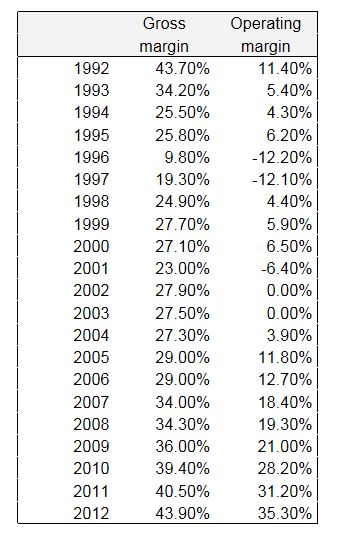
Yes, we know that Jobs left in the 80s and Apple was mismanged for years.  But Apple products were still loved by fans and were often said to be the best computers out there.  And yet this is their margin history. 

Things are different now for sure once Jobs came back and fixed the place up.  But there is no guarantee that Apple won't go back to what it was before Jobs came back.  It can still be making the best products, but the above shows that that doesn't guarantee fat margins.

The last time Apple had gross margins above 40% was in 1992 and it went down since then.  Here is what the 10-K said about the drop in gross margins in 1994:

"The downtrend in gross margin was primarily a result of pricing and promotional actions undertaken by the company in response to industrywide pricing pressure."
 
And for the 1992-1993 drop, they also said it was:
"primarily the result of industrywide competitive pressures and associated pricing and promotional actions"
 
And here's a chilling quote too:
"Although the company's gross margin was 27.2% for the fourth quarter (1994), resulting primarily from strong sales of Power MacIntosh computers and the PowerBook 500 series of notebook personal computers, it is anticipated that gross margins will remain under pressure and could fall below prior year's level worldwide due to a variety of factors, including continued industrywide pricing pressures, increased competition, and compressed product life cycles".

If operating margins go to 10%, which would be respectable for a manufacturing company and happens to be the long term average for Apple since 1992, let's see what Apple looks like.  With $180 billion in sales (never mind for now that if Apple takes pricing actions to reduce margins, sales would change too but there is no telling by how much).  That would give us an operating profit of $18 billion.  At a 25% tax rate, that's a $13.5 billion net profit and $14.40/share in EPS.  10x that would be $144/share and add to that the $110 in cash and you get $254/share total value for Apple.

Of course, I don't expect Apple to post a 10% operating margin any time soon.   I'm just fooling around with figures to get a sense of this thing.

I know that the universal view is that Apple will keep creating new products just as industry-changing as the iPod, iPhone and iPad.  But if they don't, Apple may, over time, start to look more like the long term Apple than the short term Apple (with hit after hit).

In that case, the stock would be worth much less than it is now because you will have years of good hits and years where nothing really interesting happens and industry competition eats away at margins (like it has before).

Again, this is not to say that this has to happen any time soon.

Increasing Pricing Pressure
I don't cover this industry so this is just a casual viewpoint, but I do think that there will be a lot more pricing pressure in the next couple of years.  I'm not just talking about Samsung and other gadget makers catching up. 

I think the mobile industry is getting more and more competitive and it seems like that maybe growing through acqusitions and subscriber growth may be coming to an end.  When they are adding new customers and growing through acquisitions, Apple did great because the iPhone was a great way to add subscribers.

As this starts to peak out, you then get more and more price competition. When that starts to happen, then mobile operators start to look to cutting costs to provide cheaper service.

John Malone was on CNBC the other day (I may post about that later too as it was a fascinating interview on why he bought Charter Communications) and he said that he wants to consolidate the cable industry as an offset to the content providers.  He says that cable bills (due to content prices rising) has gone up so much over the years that people can barely afford it anymore.  The business model, he says, is unsustainable (mostly due to the expensive sports content that 80% of the people would not willingly pay for at wholesale).  He thinks cable will be unbundled and the old cable model will be gone in a couple of years.

This is not the perfect analogy, but I do sort of feel like the same thing is happening in the mobile market. Phones get better and more expensive to the point that people can barely pay their phone bills.  And like ESPN in the cable world, a lot of dollars seem to be going to the phone makers (Apple).

When phone companies start to see their subscriber growth stall, growth through acquisitions plays itself out and margins get pressured due to competition, it's only a matter of time before they start looking at where those dollars are going and demanding better deals.

But again, I don't follow the industry so this is just a casual observation and not expert insight at all.  We don't have to be experts in an industry to know which direction things tend to go (increasing competition = lower margins.  When customers (mobile operators) face margin pressure, they pressure their providers (phone manufacturers) etc...).   Only the timing is difficult to get right.

Conclusion
This is just a quick look at Apple.  My view hasn't really changed, but with the stock down so much it's not as interesting a short as it was last year.  But there could still be a lot more downside if these margins can't be maintained.

For these companies that depend on 'hit' products, I think it's really dangerous to normalize, or capitalize super-high margins far into the future (which is what you're doing when you put a 10x multiple on it).

I understand the bull argument too.  Apple has the eco-system, it's not just a gadget marker.  It has the great stores.  But to a large extent, I think these things are tied to and depend on Apple making cool gadgets.  Who the heck would go to an Apple store if they didn't have cool products?  Who would download anything from the app store if they didn't have the latest cool gadget? 

Lollapaloozas (Munger's definition), like leverage, can work both ways.

Although I am way less bearish than last year, I am still very skeptical of this stock.  And yes, I know, to the bulls this whole post must come across as totally ludicrous.  I have no idea what is going to happen.  This is just sort of a thinking out loud thing.

Oops, and the title of the post:  I was going to make some comments about Newton's laws of motion, the apple etc... but forgot to do so.  But never mind. You can imagine for yourself all the bad jokes I might have come up with...


Thursday, April 11, 2013

Wells Fargo History Website

OK, so maybe I'm the last person on the planet to notice this, but I just found this website by accident (trying to find the WFC 2012 annual report). 

It looks like it was put up recently (?). 

So Loews puts up a comic book, JPM puts up a nice promotional video, but WFC tops it all with an entire website with videos and whole bunch of history.  This is great for people (like me) who love business history, seeing historic photos and film clips etc.

Here's the website:

http://www.wellsfargohistory.com/

My computer / internet connection is acting flakey now so I can't watch the videos (keeps stopping etc...) but I can't wait to see them all.

And of course, the best thing there are the annual reports going back to 1967 (why not further back?  They are 160 years old, aren't they?). 

http://www.wellsfargohistory.com/archives/archives.html  (click on annual reports, but not on the picture below because it's just a picture)


This should really be the standard for corporate websites.  I don't know why most companies only put annual reports on the website going back four or five years.  Do they have something to hide?  For that matter, I wish they would put up detailed, downloadable spreadsheets (like Sony does on their website) going back decades.  The world is moving in that direction with downloadable spreadsheets in SEC filings.

The problem with things like Value Line and Morningstar is that the corporate income statement / balance sheet data only goes back ten years or so, and the data is often wrong.  So if corporations put that sort of thing up themselves, it would be great.   We can't assemble that stuff ourselves as SEC filings only go back to 1994 or whenever, and annual reports on websites don't go far back at all.

OK, so this is more like a tweet than my typical post, but I really like what WFC did here so...

Anyway, here's some stuff from the website I cut and pasted without permission.


This is why people hate banks these days.  No banks give out stuff like this anymore...


And check out the beginning of high tech banking from home (?)... 
 

And ads...


And I just put this picture in here because it looks cool...


Check out the site!   (and no, this sounds like a sponsored post but it's not!)

JPM 2012 Annual Report

So the JPM annual report was put up yesterday.  There is not much new here but as usual I'll just make some simple comments and highlight things that struck me.

One thing, though, is that at the front of the annual report (and at the end of Dimon's letter to shareholders), they mentioned that they put up a video about JPM.  You can see it here.

So, Loews puts up a comic book and here JPM puts up a promotional video.  What's going on? 

Actually, I do think it's a good thing that JPM (and others) get their stories out there.  The general press and even the financial press is so biased and tends only to talk about the bad stuff (if it bleeds, it leads works in financial journalism too, I guess).  And there's nothing wrong with having a video like that out there.  I'm kind of surprised that there are 200+ likes and only 6 dislikes.  Maybe JPM has control of this 'channel' (YouTube).  On a typical YouTube post, you would have all sorts of nasty comments, even for good videos.

But anyway, it's a sign of the times.

As usual, I won't summarize the whole report, but just point out some things.

The Usual Figures
Here's the usual stuff that JPM shows.  Tangible book value has grown from $16.45 to $38.75 from 2005-2012.   That's +13%/year.  As I always say, this is great given what happened between 2005 and 2012.


Long Term Performance
And here's some long term stuff that they showed on investor day.  Dimon shows that shareholders would have done well investing with him since his Bank One days.  Since the Bank One days, Bank One/JPM since March 2000 has gained 8.6%/year versus +1.4%/year for the S&P 500 index and -1.0%/year for the S&P Financials index.

Since the merger with JPM, JPM has underperformed the S&P 500 index a little, but outperformed the S&P Financials index.


Long Term Tangible Book Value per Share Growth
And this table was in the annual report and I don't think it was in the investor day presentation.   It is basically the same as the above but compares growth in tangible book value per share over time with the S&P 500 index.  Share price performance is important, as that's what determines total return to shareholders, but CEOs can't control valuations.  If valuations are high at the starting point and very cheap at the end point, it may not show how well the CEO has actually done.

From this table we see that since 2000, Dimon has compounded tangible book value per share at a 13.4%/year pace compared to 2.6%/year return in the stock market; that's a 10.8%/year outperformance.

Since the merger in 2004, tangible BPS has grown +15.4%/year versus +4.8%/year for the S&P 500 index.  Pretty impressive.


Capital
And this was all done while improving capital ratios.  Not only has JPM grown tangible BPS at a respectable clip over the years despite the financial crisis and even the whale loss, it has done it while increasing capital ratios.

Dimon says, JPM has "been able to grow its business, increase dividends, buy back stock AND materially increase capital ratios".


Dimon said that dividends will go back up to $0.38 per quarter (pre-crisis level) in the second quarter of 2013, but share buybacks would be half the level of last year because they want to get to the Basel III target capital ratio by the end of 2013 (they will buy back an additional $6 billion this year).

Whale Loss
Obviously, the first issue covered is the whale loss.   He takes full responsibility for it and apologizes to everybody and then covers some key points to prevent something like this from happening again.   You can imagine what he means for each point:
  • Fight complacency
  • Overcome conflict avoidance 
  • Risk management 101:  Controls must match risk
  • Trust and verify
  • Problems don't age well
  • Continue to share what you know when you know it
  • Mistakes have consequences
  • Never lose sight of the main mission: serving clients


Senate Report
I'm reading the Senate report on the whale loss (and embarassed to say not quite done with it), but I have something to say about that.  This wasn't mentioned in the annual report but I am just tossing my thoughts in here.  

Does it make me uncomfortable?   Yes, of course.  There are a lot of disturbing things in there, particularly the mismarking of the position and some of the discussions between the trader and his supervisor (level below Ina Drew). 

But on the other hand, the way the report is written, it seems to show this incident in the worst possible light and forces the facts into a story that the committee wants to tell.

For example, the report says that the CIO was supposed to use the SCP (synthetic credit portfolio) to hedge the overall risk that JPM is exposed to.  But contrary to JPM's claims, the SCP was in fact not a risk hedge but actually added risk and was in fact just a huge speculative, proprietary trade.  Or something like that.

The reality the way I understand it is that the SCP morphed into something completely different due to their attempts to wind down the position.  Someone had the horrible idea to put on offsetting positions to reduce the book instead of just unwinding it.  And this turned out to be a big mistake.  But it's hardly a situation where someone was secretly making huge directional bets on market direction and things like that.

Also, the report says that the SCP was never really a hedging transaction as nobody within JPM can tell the committee exactly which positions / loans the SCP was supposed to hedge.   In GAAP accounting, you have to have an exact match to use hedge accounting.  But in these so-called 'macro-hedges', that is often not the case.  For example, in the old days, some equity trading desks would routinely buy put options or short index futures as a 'hedge'.  This may have been partly to hedge the inventory of stock that they held for market-making purposes, but it was also a business hedge; if the markets tanked and business dried up, they can at least hope for some payoff from the puts or short futures position.  It works sort of like business self-insurance; you spend x% of your monthly net revenues on insurance. 

In the case of JPM, they have all sorts of built in risk, particularly credit and interest rate risk and exposure to 'tail' events (sudden worsening of credit markets).  When these tail hedges are put on, you can't really point to any single loan or position that you say you are directly hedging.  It's much broader than that.  But the report states that since JPM / CIO people couldn't point to specific positions it was trying to hedge, that the SCP was in fact just speculation and not hedging.

The report also makes it seem like these derivatives are too complex and dangerous, but upon reading JPM's report and the Senate report, I find that that wasn't really the issue.  The investment bank had no problem pricing and managing similar positions.  The big problem was that the CIO didn't mark their books accurately and kept adding to losing positions.  This is not too different than Nick Leeson blowing up Barings; there is nothing too complex and difficult with simple, straight index futures contracts.  But there is a big problem if you don't mark your positions correctly and you keep adding to positions hoping things will turn around.

The problem seems to me what I initially suspected; Ina Drew was sort of like a teacher's pet and operated outside of the class rules.  If Ina is OK with it, Jamie is OK with it.  And noone messes with her or challenges her business.  THIS was the big problem.   The same trades would not have happened if it was in the JPM investment bank (or if it was, it would have been managed very differently).

And I don't think this will ever happen again. I don't think JPM set up all of these checks and balances just so that some people wouldn't have to operate within them.  It's very clear to me that that was the biggest flaw in this case; JPM had all the tools, expertise and understanding to prevent something like this, but it wasn't applied at all due to the above "teacher's pet" syndrome.

The Senate report wants to use this incident to prove that derivatives are too dangerous, that trading is too dangerous, that risk management models don't work (Dimon has always said for many years that he doesn't like VAR models) etc...    But my view is much simpler than that.

Having said all that, I am not saying there can't be more losses elsewhere in the bank.  There probably will be other derivatives losses, just as there will be losses on municipal bond holdings, sovereign credit holdings, credit card loans and mortgages.

On the contrary, I think Dimon and JPM handled this situation very well.  It did take the press to call management's attention to the problem position, but once they realized what was going on, they disclosed it, put a team on it and resolved the problem within the year.  And it's amazing to look at the above performance figures (earnings, tangible book growth etc.) and think that people are calling for Dimon's head (while many CEO's will make stupid mistakes that will cause their firms to book losses constantly without anyone calling for their heads!).   Dimon 'only' made 15% return on tangible book because of the dumb whale loss; off with his head!

I know many people will disagree with this view and that's OK.  I am just saying what I think and how I look at all of this.

Anyway, back to the annual report:


Port of Safety
Dimon said, "We want the public, our regulators and our shareholders to have confidence that we are the safest and soundest bank on the planet".


State of the World
And Dimon does spend some time talking about the state of the world.  I guess this is to illustrate how much potential business there is for JPM in the future (contrary to calls that investment banking is dead).

Not that I get macro advice from bank CEO's, here is what he sees:
  • World GDP is projected to grow +5%/year through 2017
  • Keeping pace with global GDP growth will require $57 trillion in infrastructure investment between now and 2030.  This is 60% more than $36 trillion spent in the past 18 years.
  • Emerging economies will likely be 40-50% of this infrastructure spending
  • The value of the world's exports grew an average +11%/year between 2001 and 2011.  This may continue "if not accelerate"
  • Global cross-border capital flows grew by 4x in the last two decades and that will likely continue
  • Foreign direct investment grew as a share of total global capital flows in the last five years from 22% in 2007 to 38% in 2012.  This trend will likely continue
  • In 1990, 19 of the top 500 multinationals were from developing economies.  In 2012, 125 were. In 2012, 32% of global capital flows went to developing countries versus 5% in 2000.  China and India will account for the greatest number of new multinationals in the next 15 years
  • Majority of world's population live in urban areas.  This will grow to 70% by 2050.  This will fuel demand for infrastructure, clean water, schooling, healthcare etc...
  • Total global financial assets of consumers and business were $219 trillion in 2011; this is projected to grow 6%/year through 2020 to $370 trillion.

U.S. in Great Shape But...
He points out the usual strengths of the U.S. (similar to Buffett's view) but points out problems too:
  • Needs good immigration policy:  it's a problem when 40% of foreignors who get advanced degrees in science, technology, engineering and math can't stay in this country even if they choose to.
  • Infrastructure:  we need a good 20-year infrastructure plan
  • Citizens need better opportunities:  problem when 50% of inner city high school students don't graduate
  • Need rational long term fiscal policy

Risk
Dimon also points out there are risks to the current global fiscal and monetary policies.  He says, "We don't know the outcome of these efforts".

He points out that in 1994 and 2004, short term and long term interest rates went up 300 basis points within one year and a lot of people got hurt.

He is not predicting a similar rise in interest rates but he says the bank is prepared for one.  The bank is positioned such that if rates went up 300 basis points in one year (and all else equal which they are not!), JPM's pretax income would be $5 billion higher.

He says, "You should know that it costs us a signicicant amount of current income to be positioned this way.  But we believe it is better to be safe than sorry".


Demand/Opportunities
Dimon doesn't seem like a guy that listens to management consultants, but he does quote McKinsey estimates to show the opportunities for the bank:
  • Corporate equity and debt issue demand could grow 25-30% over the next five years
  • Global investor client demand could grow 20-25% by 2017
  • Loans outstanding for small to mid-sized enterprises projected to grow 6%/year through 2020.  JPM grew middle market loans 14%/year from 2009-2012.
  • Investable assets of high net-worth individuals globally rose almost 9%/year from $33 trillion to $42 trillion between 2008 and 2011.  This is projected to grow 6%/year through 2020.
  • U.S. consumer financial assets grew 6%/year in the last decade. McKinsey thinks this will continue through 2020.

Conclusion
So JPM is looking pretty good to me.   At $49.40, it's trading at around 1.3x tangible book so it's not such a table-pounding buy anymore, but it's still a pretty solid hold if not buy.   If it can grow tangible BPS at 10%/year and trade at 1.5x tangible BPS in two years, that's a $70 stock and a 20%/year return (before dividends) without heroic assumptions.   (Tangible BPS has grown at 13%/year in the recent past, but dividends may go up in the future so I used a lower BPS growth rate.  But some of that dividend payout will be offset by improving ROE if the environment continues to improve).

As Dimon said, JPM has been "able to grow it's business, increase dividends, buy back stock AND materially increase capital ratios" in recent years.  But you can also add, "and absorbed the whale loss with barely a blip on the income statement and balance sheets".

Friday, April 5, 2013

Loews 2012 Annual Report

So the 2012 annual report is up on the website.  They revamped it and Loews even has a new logo.

Here is the new logo:

I'm not an art major or anything like that so I don't know anything about it but my first impression was that this looks a little retro, even Art Deco-ish.  Loews is going for a more contemporary look with this, apparently, but it looks more retro than modern.  But then again, what do I know.  I'm sure they paid good money to a well-schooled designer to create it so it must be good.

For reference, here is the old logo:


Not to complain too much, but many of the materials on the website including the ones updated in 2013 still has the old logo.  That sort of spoiled the 'freshness' of the new website.  

Anyway, what the heck am I talking about?  Who cares.   Let's look at some stuff in the annual report.   This is not a summary by any means, but just random comments that came to mind as I read through the report.

There is really nothing new here, just stuff we already know.  In this year's annual report, they put in the stock price performance versus the S&P 500 index for 10, 20, 30, 40 and 50 years:


...and the usual shares outstanding comparison.   They are very good allocators of capital and they do buy back a lot of stock.  Share count is down by 2/3 since 1971 which is very reassuring; these guys aren't going to go on a buying binge just to get bigger or use up excess capital.


They explain their approach to investing.  I think investors are antsy that L is sitting on so much cash; they wonder when they will do a big deal that might get the market excited about L.  So this is their response to that, I suppose.


Substantial Investments
Tisch did say that although they haven't done any large acquisitions, they have been investing actively at the subsidiary level.  L has spent or committed $6.5 billion since 2010 through their subs. 


Sum of the Parts Valuation

And as usual, here is the sum of the parts valuation of L they include in their annual reports and presentations (stock price data as of Feb 1, 2013).   I haven't talked about the numbers in this post at all since I already did some work on the 10-k in my previous posts:  Loews Adjusted Book Value Update and More Adjustment to Loews Book Value.

Hedge Funds
L mentioned hedge funds in the annual report, that they invest 5% of CNA's investments in limited partnerships.  People are always asking who they allocate capital to, or what the performance is like.  In the annual, they said that in the past 15 years the partnerships have earned 11%/year.  In a recent interview, Tisch said that the hedge funds over time have earned 5-10% more than the 3 month treasury rate.

Also, at the website on the annual report page is a presentation called "Company Overview" which is worth reading.

From there is a little more about L.  I won't summarize everything that's in there but here are some interesting things I'll cut and paste here.

First is how well Diamond Offshore and Boardwalk has done for L.  People criticize Diamond Offshore as having an old fleet, but Tisch explains in the annual report that the age of the fleet might be old, but they have spent a lot of money building new rigs and rebuilding old ones and these rigs do get contracted out at good rates so that's what counts.  Diamond's returns over time is shown in a table below.  Also, L has taken a lot of cash out of Diamond over the years.  Boardwalk has also done well and even though they just invested in 2003, they have already gotten back their total investment (invested a total of $3.2 billion and got it all back already and they still own a bunch). 

That's pretty good.


The company overview presentation shows some promising trends in their subsidiaries.  Here's one that Tisch has been talking about; the firming of pricing in P&C insurance:

If this continues, obviously it would be good for CNA, which accounts for a large part of L's value. 
 

Contrary to what you would imagine, ultra-deepwater day rates are trending nicely, getting back up to the 2007-2008 highs.  This is good for DO, of course, since they have some new rigs coming online soon.

 DO has performed well over time:

And they think that natural gas demand will rise over time:


Lotta Value: Investment Hunter
And I don't know if this is desperation, but they put up on the website a comic book, oops, sorry, I meant graphic novel (this makes it OK for adults to read, I suppose) to tell the Loews value story.  I know they have been frustrated for years that L doesn't trade at or above the sum of the parts.  Tisch believes that L is worth more than the sum of the parts, and it has been frustrating for him for many years.

So this is where they go.  They turn to a comic book!  Oops, I mean graphic novel.  I suppose it's OK.  There's nothing wrong with having some fun.  But I would be shocked (and scared) if Lotta Value helped narrow the discount between stock price and intrinsic value. 

I know Warren Buffett has been frustrated too with the stock price of Berkshire Hathaway, pounding the table recently in his annual reports insisting that BRK is worth far more than book value. 

If Buffett did a comic book, maybe he would borrow some talent from Iger (Disney) and do a better one.   Who knows.

This one certainly won't appeal to the younger crowd... but then again, the younger crowd is not the ones with the money, I suppose.


This is just the first page.  You can download the whole thing at the L website.
For people who are too lazy to even read a comic book, they did a video so you can watch that instead.

Lotta Value book and video

I suppose it's good that they are trying new things to get the word out and try to narrow the discount.

Conclusion
The new website is nice.  Simple and fresh, with some new stuff on there.  It would be really great if they put more meat in the history section.  I'm sure there is a lot of interesting stuff they can put there.  The new logo to me is nice even though it doesn't seem contemporary to me.  But what do I know, and why am I even talking about it?  What difference does it make to an investor?

Flipping through the annual report and company overview, I get the sense that L is really on top of things and are working hard to create value.  There does seem to be a lot of potential in their various areas of investment.  If the CNA turnaround really works and they get their combined ratios down, premiums go up and rates keep firming, there can be some real upside in the stock as CNA is still trading cheap.  Interest rates might have to go higher, though.  

Diamond Offshore looks good too in the longer term as it does look harder and harder to find cheap oil and oil companies will need to keep drilling. 

I'm actually surprised at how well Boardwalk is doing despite low natural gas prices and L sees a lot more growth ahead which is good. 

Loews Hotels too seems to be more active.  For a long time, it seemed to me that it was just there.  They owned some nice hotels but it just didn't really do anything.  Now it seems like there is some activity going on, so we'll see how that goes.

Anyway, other parts look interesting too.  Have a look for yourself.