Thursday, May 31, 2012

Loews Corp: Recent Returns, Adjusted Book Value etc.

People always talk about L in terms of sum-of-the-parts and whatnot, and I just realized that I never really looked at their returns over time and in different time periods.  This may not be necessary as you know the Tischs' have created value over time as they usually illustrate in their annual reports, and if you buy L at a discount to it's intrinsic value, you can hardly go wrong.

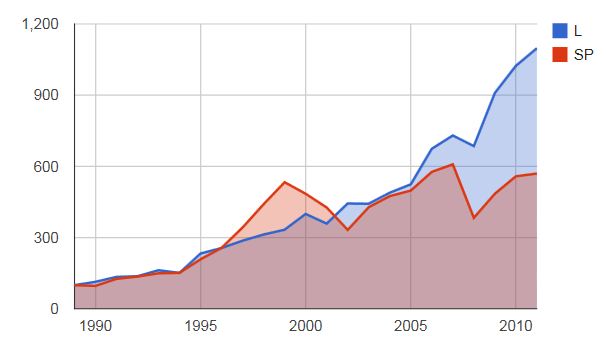
But as I gathered up some information to create my own long term data, I noticed something.   First of all, here is what it said in the 2011 annual report:

"Over the past 50 years, the price of Loews common stock has grown at an average annual rate of approximately 14% compared with an approximate 6% growth rate for the S&P 500."


That's a long term outperformance of 8%/year, pretty impressive especially over 50 years.

In the 2010 annual report, they made a similar comparison.  They compared the 50 year average total return from 1960-2010.  The S&P 500 annual total return was +9.6%/year and Loews' annual total return was +17.6%/year.   That's also an outperformance of 8%/year over 50 years, which is pretty astounding; of course this is not surprising as the two 50-year periods share mostly the same data points.

The 2009 annual report had a simliar comment and data, saying that the L common stock appreciated by 15.9%/year versus 6%/year for tthe S&P 500 index.  That's 9.9%/year outperformance over 50 years.

The 2008 annual report said that the stock price appreciated 16.1%/year versus +5.7%/year for the S&P 500 index.  So that's +10.4%/year in outperformance.

OK, so where am I going with this?

Pre-2007 Annual Reports
And then I get to the 2007 annual report and I notice that their long term outperformance chart/graph is a 25 year one.  (I've been reading these reports in real time for years, but I didn't really think about this at the time).

In the 2007 annual report, the long term information was that L stock appreciated +14.8%/year vs. +9.8%/year for the S&P 500 index, and BPS grew +13.4%/year in the past 25 years.  That's a stock price outperformance of 5%/year.  Not bad at all.

Here are the comparisons in the annual reports over time:

                          L price          S&P           BPS             Time period
2005 AR:          +14.9%           +9.7%       +12.7%        25 years  (exclude dvd)
2006 AR:          +16.1%         +10.3%       +14.0%        25 years  (exclude dvd)
2007 AR:          +14.8%           +9.8%       +13.4%        25 years  (exclude dvd)
2008 AR:          +16.1%           +5.7%                           50 years  (exclude dvd)
2009 AR:          +15.9%           +6.0%                           50 years  (exclude dvd)
2010 AR:          +17.6%           +9.6%                           50 years  (incl dvd)
2011 AR:          +14%              +6%                              50 years

So the respective outperformance of L stock versus the S&P 500 index was:

                    L stock price
                    outperformance vs. S&P 500
2005:             +5.2%      (25-year comparison)
2006              +5.8%      (25-year comparison)
2007              +5.0%      (25-year comparison)
2008            +10.4%      (50-year comparison)
2009              +9.9%      (50-year comparison)
2010              +8.0%      (50-year comparison)
2011              +8.0%      (50-year comparison)

Part of the reason why they switched to 50-years in 2008 is that it was the 50th anniversary of L's listing on the New York Stock Exchange, and I think it was meant to be a "looking back since listing" sort of thing.

But it also turned out to be a really timely shift. 

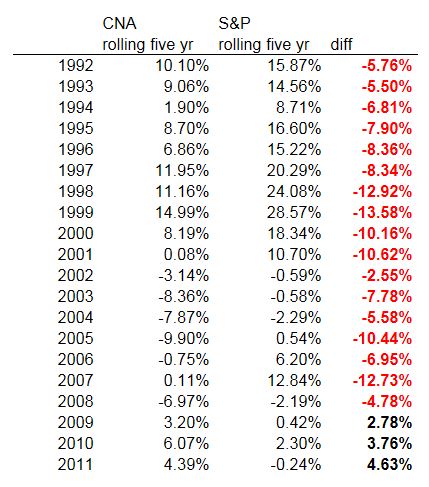
Let's see what would have happened if the long term comparison stayed at 25 years instead of switching to 50 years.

                                                                     Relative performance
                   L stock         S&P 500               over 25 years
2008           +11.0%         +7.0%                 +4.0%
2009           +10.6%         +7.9%                 +2.7%
2010            +9.0%          +7.4%                 +1.6%
2011            +8.5%          +6.8%                 +1.7%

 (these returns are excluding dividends since that is how L presented the performance when they showed 25 year comparisons).

So instead of showing an 8-10% long term outperformance, if they kept the "long term" time frame at 25 years, the 5-6% outperformance shown in 2005-2007 would have shrunk to 1.7%/year over 25 years through the end of 2011.

I hold the Tisch family in the highest regard, and they are the straightest, most honest people in business.  So I'm sure they're not trying to fool anyone.

But it is still a little annoying.  I know it's a little tricky to show long term performance when book value is not the best measure of performance, and the stock price performance too can be misleading over different time periods.

BRK and LUK both show their data going back to inception so we can quickly do our own calculations for various time periods and not be 'fed' return figures for periods that look good (I'm not accusing anyone of anything, but that was a pretty timely switch so you can't blame anyone for wondering!).  There will never be any confusion about long term performance with BRK/LUK because the data is all right there on page one.   The average return since inception is also right there.

It doesn't take a whole lot to do that (but it sure is a pain to assemble ourselves with the splits and all that!).    I understand there is a reservation about book value per share (may not reflect accurate value of the firm), and the stock price may be misleading at times too.

But if book value per share (which they used to show a 25-year chart of) and stock price is important or relevant enough to mention in the shareholder letter, then it may be good enough to present in an easily accessible form.

I know, I know, I don't want to turn this into a "Why can't you be more like BRK?" post (too late?).

Recent Performance
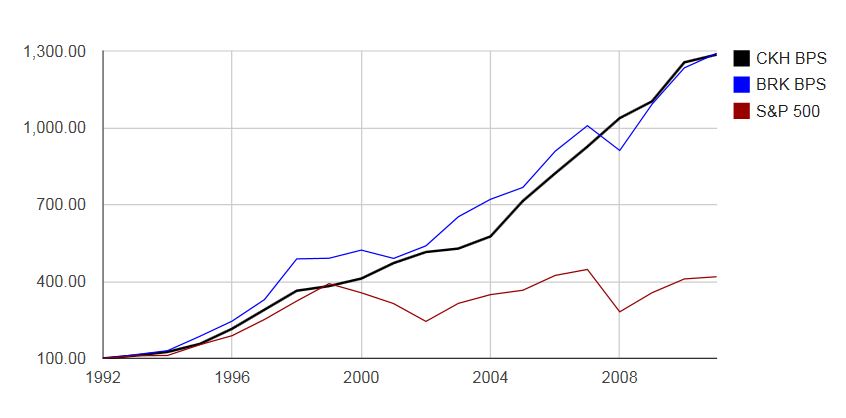
So here's the data the way I've looked at other capital allocators recently.  I know book value isn't the best indicator of value for L as they have large, listed subsidiaries (that are consolidated and therefore not marked to market).  But as L themselves have demonstrated, the stock price and book value have tracked closely over time.


L Book Value Per Share (incl dvd) versus S&P 500 Index (incl dvd)

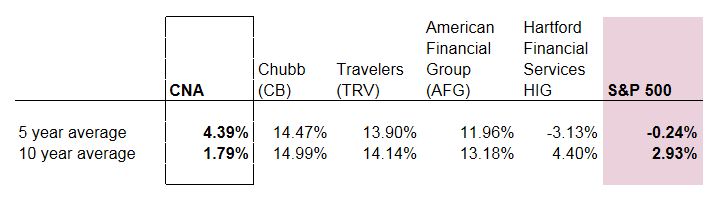
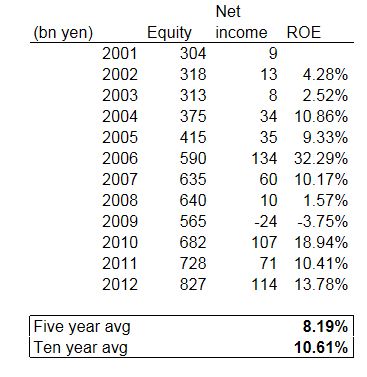
These are the returns for the respective time periods:
                                                                                                +/-                    +/-
                                     L BPS      L Price         S&P 500       BPS basis        Price basis
Five year average         +10.3%     -1.3%         -0.2%           +10.5%              -1.1%
Ten year average          +11.8%    +8.3%        +2.9%           +8.9%               +5.4%
Since 1989                    +11.5%    +7.0%        +8.2%           +3.3%               -1.2%

On a book value basis, L has done pretty well over time, especially over the past five to ten years which is very encouraging, but hasn't done too well on a price basis; if you owned L stock since 1989, you haven't outperformed the S&P 500 index, which is kind of surprising.  Over the past five years you haven't done too well either.


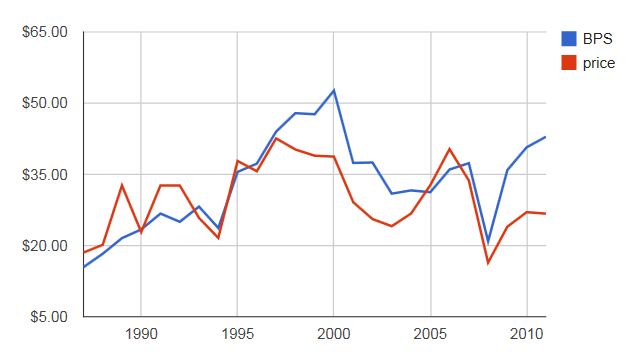
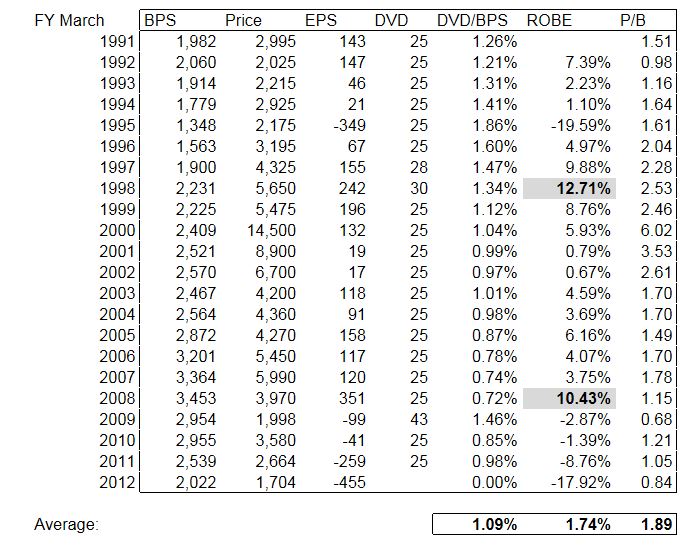
L Stock Price versus L BPS


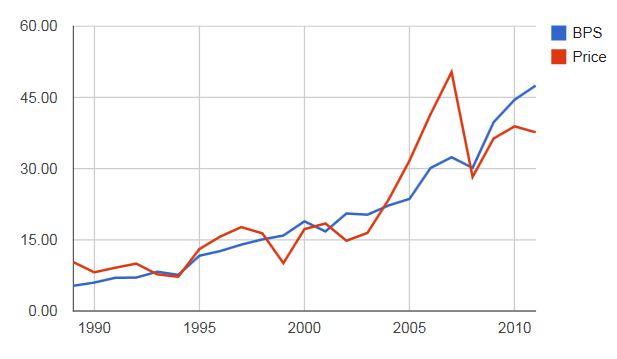
The long term stock performance is hurt by the fact that L was trading at close to 2x BPS back in 1989.  There may have been some value not reflected in book value like in 2007.  Back in 1989, CNA was trading at 1.5x book and CBS was probaby on the books for less than market value.  The 10-K's only go back to 1994 so I can't see what value there was not included in BPS back in 1989.

Even still, it's a little surprising especially given the 50 year outperformance figure that I have been taking for granted when shown to me in the annual reports.
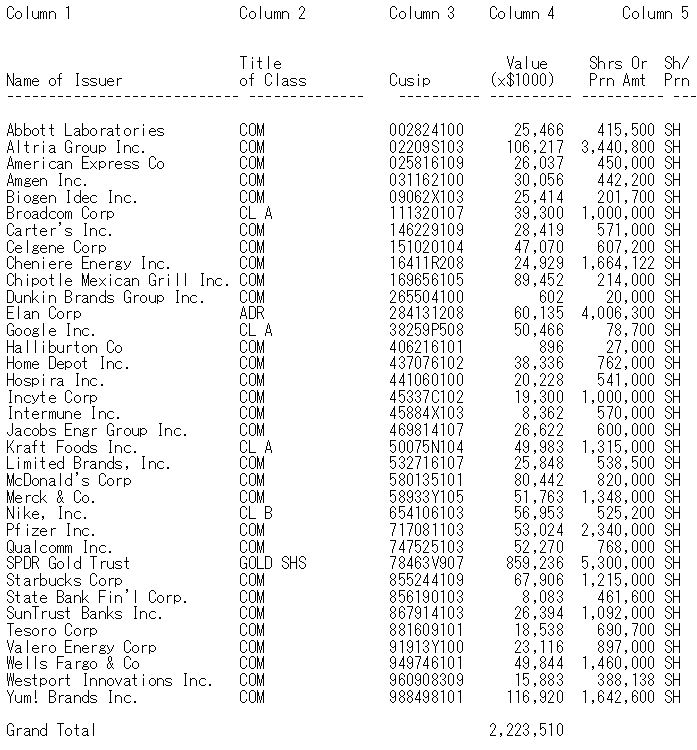
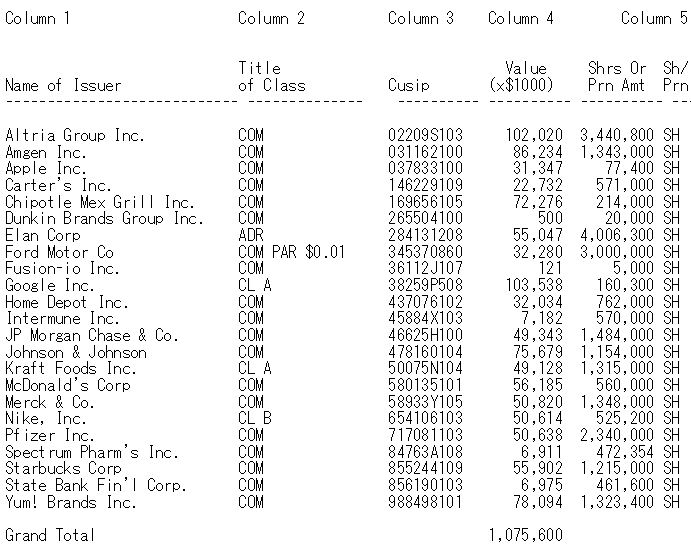

Loews Valuation
Anyway, Loews is looked at usually as the sum of the parts.   Loews presents it nicely in their annual report and presentations.  

But sometimes, when someone says something is trading at below the sum-of-the-parts, you want to know how the sum-of-the-parts actually did in the past.  We looked at L's performance on a BPS and price basis, but I wanted to see what it looked like on a sum-of-the-parts basis.  

First of all, I will say that a sum-of-the-parts analysis is fine and a one-time snapshot is enough as long as there is motivation to close that gap by management, management is competent in allocating capital and the parts are good businesses (or otherwise solid assets); you know the value is there and it will eventually be realized.

But it's also interesting to see, if possible, what the stock price did versus that analysis.

Here, I am going to do a quick analysis by adjusting the BPS of Loews going back. 

Here is what I am going to do (I will only go back to the year 2001).

There are basically three listed subsidiaries that make up the biggest adjustment factor to BPS; CNA, DO (Diamond Offshore) and BWP (Boardwalk Pipelines).  I will ignore Lorillard as that has no net impact on BPS adjustment over time because the value realized is reflected in BPS (it wasn't a spinoff; the IPO was a sale so L got cash proceeds and the spin-off was actually an exchange whereby L received L stock in exchange for LO stock, like a LO sale / L share repurchase done simultaneously).  LO would have had an impact in between the tracking stock IPO and the complete spin-off/exchange, but only on a mark-to-market basis in between.  Net-net, through time, the value is realized and included in BPS.

In the back of the 10-K's,  there is segment information and the assets are also broken down by segments.  In that section, you can see the shareholders' equity of these listed subsidiaries; what the book value of the holdings is on L's books, as well as minority interest (which is the portion not owned by L). 

So all of these listed subsidiaries are carried on L's books at book.  The adjustment we have to make is to add an amount if the listed subsidiary is trading above book value and deduct from L book value if it is trading below book value. 

This is just another way to sum-of-the-parts this thing.  The advantage is that it leaves all other areas of L in the valuation at book.

March 2012 Adjusted Book Value per Share
Anyway, I'll walk through the adjustments for March-end 2012.

BPS of L at March-end was $48.96/share.

Here is the data:

                            Equity of subsidiary          P/B ratio               adjustments
CNA                     $10.3 billion                     0.64x                    -3.7 billion 
DO                          $2.2 billion                    1.90x                     +2.0 billion
BWP                       $2.0 billion                    1.64x                     +1.3 billion
Total adjustments:                                                                      -0.4 billion

The equity of the subsidiary is the equity portion that L owns excluding minority interest.  So this is what the subs are carried at on L's books.  The P/B ratio is the valuation of the listed subsidiaries' stock.

If a stock is trading above book, we have to adjust the equity upwards to reflect a higher valuation.  If it is trading below book, then we deduct.  

So for CNA, it is on the books at $10.3 billion, but to adjust that to market value, we have to take a 36% discount as the CNA stock is trading at 0.64x book value.

Doing this to all the listed subsidiaries results in the above table.  A total adjustment downward of $400 million is needed to mark these subs to 'market'.

With 397 shares outstanding at L, that's a $1.00/share downward adjustment.  

So with March-end BPS at $48.96, the adjusted BPS would be 47.96/share.   The stock closed today at around $39/share, so the stock is trading at around a 19% discount to this adjusted BPS.  That's cheap.

But then, how has this adjusted book value behaved over the years?   Has it always been trading at a discount to this?  Who needs to own something at a discount if it is declining?

Let's do the above exercise going back to 2001.  I went back and calculated all the p/b ratios for each year-end for each listed sub and did the above adjustment for every year.

L BPS and Adjusted BPS
From the above table, we see that the stock price actually does track the adjusted BPS pretty closely.  The big divergence from book value back in 2007 was mostly due to the rise in DO stock.  And that also explains the poor performance over the five year time frame.

It is encouraging that the adjusted book value has grown at +11%/year over the past ten years, pretty much in line with the growth in book value (so maybe BPS is a good indicator after all).

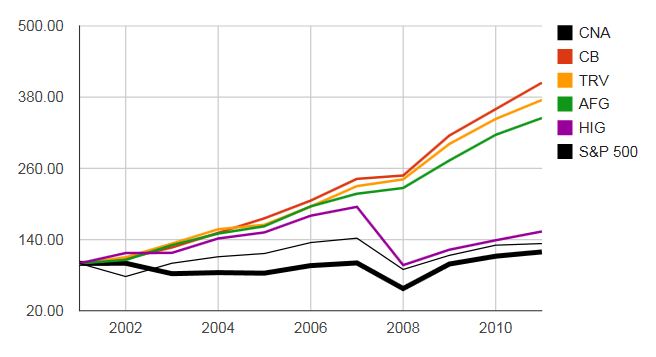
The chart below shows how closely the stock price tracks the adjusted BPS.

BPS, Adjusted BPS and Stock Price of L

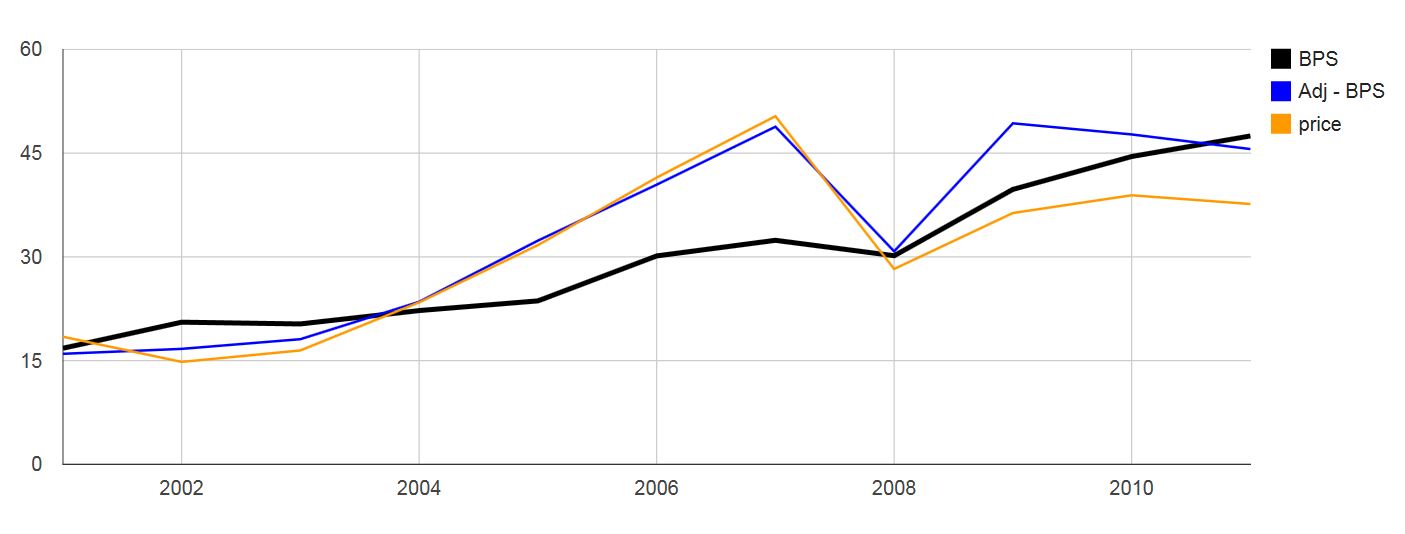
Over the past ten years, the stock has traded at 0.93x this adjusted book value based on yearly data.  So it is fair to say that at $39/share,  L is trading cheaply and can be expected eventually to trade at the adjusted book value.  It looks like the discount started after the financial crisis, so this may just be part of the anti-equity sentiment (many financials and conglomerates like BRK are also trading cheap versus historical patterns).

Anyway, this is just one way of looking at the sum-of-the-parts.  I thought it would be easier to just adjust the book value like the way I did above.  I think it makes sense, but there may be factors that I am missing that makes this not such a good adjustment.  But it seems to track well, and with my very elementary understanding of accounting, it seems at least roughly right so...


Conclusion
So, I do like L and have a lot of faith in the management there.  They are as straight and honest as can be, and this could be a stock I may recommend to people who are going away for a few years on a mission to Mars and can't access the internet or otherwise buy/sell anything.  You would want to own a solid company with good management that can allocate capital well.  L would fit that bill easily.  I would bet on L over most mutual funds, the S&P 500 index etc...

Having said that, this is sort of a pain to analyze.  Sure, the structure is really simple on a one-time snapshot basis.

But we get different performance results depending on if you look at stock price, book value or adjusted book value.  I wish they would put a good summary page on the front like BRK and LUK does.  It would be really helpful.

I was one of those that just took it for granted that L has done well over 25 or 50 years but really didn't have a feel for how they have done over different time periods, and part of that is because it was such a hassle for me to try to figure out.

I haven't changed my mind about L; it's still a great company run by great people, but I feel like I understand it a little bit better now.


Wednesday, May 30, 2012

Duquesne Family Office Gold Correction

Someone pointed out that the $859 million GLD position was in the form of call options; I missed that (don't go through filings late at night!)  So the increase in the 13F portfolio from $1 billion to $2.2 billion is largely not 'real'; just an increase due to the reporting of the notional amount of the underlying GLD represented by the call options.

That's still heck of a lot of gold, but the exposure is a bit different than owning GLD outright.

Sorry for the error, and thanks for the heads-up!

Duquesne Family Office: Druckenmiller Likes Gold

This is not a blog that tracks the buys and sells of hedge funds or anything like that, but I just stumbled on this so I thought I'd post it.  (Of course, a hedge fund manager liking gold is hardly breaking news, but...)

We all know Stanley Druckenmiller; he needs no introduction (if you do, just google him and there is plenty of short articles about who he is).  He ran the Quantum Fund (Soros' Fund) and then his own hedge fund Duquesne Capital (which he actually started before joining Soros and continued to run during his time there) but closed down Duquesne in August 2010.

I noticed that websites that track hedge funds dropped his investment activities as Duquesne Capital no longer files 13F's.  Well, that makes sense as it no longer exists.

But I did notice by chance that Druckenmiller started filing a 13F again but this time as "Duquesne Family Office LLC".  So this is his own money.

I find this interesting for a couple of reasons.  Of course, Druckenmiller is one of the all-time great traders/investors, so it's always interesting to see what he is up to.  But what is really interesting now is that he is doing a lot of the work for the family office himself.  His colleagues at Duquesne Capital left to start their own hedge fund (which Druckenmiller invested $1 billion in according to one article).

So the 13F stocks show what Druckenmiller himself really likes.  It's not his other portfolio managers' picks.  These are *his* picks.

You will notice that it's a much smaller list than what they used to file as Duquesne Capital.  That makes sense.

Anyway, here is the 13F that was filed in May for the portfolio as of March-end 2012  (Look up Duquesne Family Office at sec.gov).  See table below.

It is a small portfolio in terms of number of stocks and there are many familiar names in there.  It sort of feels right to me as I feel like I can get a sense for why these stocks would be interesting; Wells Fargo is a great bank, YUM Brands is a great way to get exposure to China without having to deal with Chinese companies/fraud etc..., Chipotle is just recreating the fast food business, American Express is a transaction driven high return on capital business (paid on number of transactions, not loans outstanding etc.) etc...

SPDRs!
But then here's the whopper:  5.3 million shares of GLD, the SPDR Gold Trust.  As of March-end 2012, that position was worth $859 million.  The total U.S. equity portfolio on the 13F is $2.2 billion, so that's a whopping 40% of the portfolio invested in gold.    Einhorn has 10% of his assets invested in gold.  40% is pretty big.

[Correction (added later):  The GLD position is in the form of call options and the $859 million is just the notional amount; I didn't notice that the first time I looked at the filing.  ]

As of September 2011, Forbes had Druckenmiller's net worth at $2.5 billion or so.  So this $2.2 billion portfolio constitutes most of his wealth.  Given that, this 40% exposure to gold is pretty big.

This is not like some billionaire that files a 13-F, but the U.S. equity portfolio is only 10 or 20% of his net worth or anything like that.  It looks like this is a substantial portion of Druckenmiller's wealth is represented here.  Of course, we don't know the real exposure as Druckenmiller probably has futures and options positions that won't show up here.  We have no idea what his S&P 500 index futures and gold futures positions are.  Also, I am leaning on Forbes' estimate of his net worth too and I have no idea how close those are, never having been a billionaire with net worth estimated by them.


13-F for Duquesne Family Office LLC filed on May 14, 2012 for Quarter ended March 31, 2012


And here's the other puzzle.  The first filing the family office made was in February of this year and there is no GLD position there.  Here it is:


13-F for Duquesne Family Office LLC filed on Feb 9, 2012 for Quarter ended Dec 31, 2011

Again, this is a nice, small (in terms of number of names), manageable portfolio of stocks.

First thing I notice is that Apple is here but not in the later filing, so Druckenmiller sold his Apple shares in the first quarter during that Apple frenzy.  I haven't tracked back old Duquesne Capital filings, but I think they've owned Apple for a long time. 

Also, he owned JP Morgan as of the end of 2011 but was out by the end of the first quarter.  Did he dump it because he was hearing on the street about the whale and what Dimon would eventually call a tempest in the teapot and then later an egregious mistake?

The other thing, of course, is the GLD position.  It's not there.  So did he just buy gold in the first quarter of 2012? 

The problem with these hedge funds is that you never know what their futures positions are from these filings and there are no futures 13-F's (that I know of). 

So it's possible that Druckenmiller had physical gold in storage at the Fed, had a big futures position he kept rolling or whatever.  And for whatever reason, he converted that into SPDRs.  This is certainly possible. 

That would explain the other thing I notice;  the grand total of the portfolio is $1.075 billion in the December 2011 quarter filing but $2.2 billion in the March-end 2012 filing. 

Since the 13-F is for only U.S. listed equities, there could be a lot of reasons for this.  It could be as simple as the above gold position conversion into an 'equity' position.  It could be due to sales of foreign stocks (that are *not* in the 13-F's) and purchase of U.S. equities (which *are* in the 13-F).

It could also be that he took some money back from people he had run some of his money, but there is no proof of that. But if he had assets managed by others, that would not show up in the 13-F.  So that is certainly a possibility.  It could be any of the above reasons (or another reason I didn't think of).  If I let my imagination run wild, it almost looks like he just yanked a billion or so out of a macro fund he invested in and just put it in GLD's instead.  But that is probably not what happened.   It just sort of fits, but we really have no idea what is going on here (other than that he likes gold). 

[ Correction:  Since the GLD position is just the notional amount of the call option, the above is irrelevant; there was no addition in the dollar value of the portfolio. ]

Anyway, this post is neither here nor there, but I thought it was a little interesting.  I am a fan of Druckenmiller, even though I haven't really followed too closely what he has been doing over the years (except reading about him in the papers). And I normally don't look so closely at 13-F's and try to "diff" the filings from one period to the next. 

Again, this is just something that I stumbled upon, and I think it's sort of a gem in the sense that we get to take a peak at the "pure" Druckenmiller; what he likes with his *own* money doing his *own* thing (and not his staffs), and not under pressure to perform from clients.  It's like peaking into someone's PA (personal account), and that's always fun to do. 


Tuesday, May 29, 2012

CNA: One-of-the-Parts (of Loews)

Loews (L) has been, for years, a popular sum-of-the-parts play by value investors and it seems that's it's always trading at a discount.  I suppose that's normal for a conglomerate.

I am a big fan of L and have a lot of confidence in the Tisch family but one thing has always been nagging me about L, and that is:  What is up with CNA?  I'm sure I'm not the only one wondering about this.  So I decided to take a closer look.

Now L is a disciplined value investor and stays away from silliness, thinks long term and does all the right things.   They sound a lot like Buffett in many ways.  They concentrate their bets, are very shareholder friendly and all that.

But I just never really got CNA.  I'm sure they bought CNA well in 1974, but the performance there has been less than stellar. Yes, you have to think long term and not worry about short-term problems there. (I was a little surprised that they took such a hit back in 2008, but those were mostly marks against them and BPS has bounced back quickly so maybe it wasn't as bad as it looked at the time; but still, you don't want to see that sort of book volatility!).

So anyway, thinking long term is exactly what we have to do so that's what I did.  Since I can't see long term into the future, I decided to take a long term look at CNA going back. 

And this is what I found:

CNA Book Value Per Share versus S&P 500 (w/dvd)

This is the book value per share (BPS) of CNA versus the S&P 500 index since 1987.

Here is how they compare:

                                      CNA BPS                 S&P 500 (incl dvd)
5 year average                +4.4%                      -0.2%
10 year average              +1.8%                     +2.9%
Since 1987                     +4.5%                      +9.5%

CNA book value per share over the past five years has beaten the S&P 500 index and that is certainly encouraging, especially given what happened in 2008 (they gained back the big loss in 2008 and then some).  (CNA BPS change includes dividends) 

But if you look at CNA over the past ten years and since 1987, it's been pretty dreadful.

A quick calculation shows that if CNA did just as well as the S&P 500 index since 1987, the book value of L today would be $82.40/share instead of $47.49/share (through year-end 2011).  The sum-of-the-parts of the listed holdings plus cash and investments at the holding company would be $80/share instead of $42.59/share (from 2011 annual report).

But of course, we can't just look back and say that; every portfolio is going to have a dog.  We can't say, well, if we owned this instead of that, we would've been better off.  So that's certainly not fair.

But still, from such a prominent value investor, we'd expect better than this for such a large part of the portfolio.

Here is the comparison between CNA (book value growth w/dividends) and the S&P 500 index return (w/dividends) over rolling five year periods.  This is the measure used by Buffett in a recent annual report showing how BRK should retain earnings if they can keep outperforming the index.


CNA versus S&P 500 Index by Five-year Periods


It's kind of stunning how thoroughly CNA has been outdone by the S&P 500 in both up-markets and down-markets. Reading the annual reports, you'd think that it was all about the poor insurance market, but the data shows constant underperformance since 1992 which should have included some good years in the insurance market, economy etc... But you see no trace of that here.


CNA is a Key Value Driver
L has owned most of CNA since 1974 and it's been a large part of the portfolio since then.  Below are some figures that show how big of a factor CNA has been in the value of L over time.

CNA as Percentage of Loews by Market Cap
           %CNA              CNA                 Loews                    CNA %
           owned by L       market cap       market cap             of L mkt cap
1994    84%                 $4.0 bn             $4.8 bn                   70%
2000    87%                 $7.1 bn             $10.2 bn                 61%
2011    90%                 $7.2 bn             $14.9 bn                 43%

CNA as Percentage of Loews by Book Value

             L equity          CNA equity     L share of CNA      CNA equity % L equity
1994        $5.4 bn             $4.5 bn           $3.8 bn                  70%
2000      $11.1 bn             $9.6 bn           $8.4 bn                  76%
2011      $18.8 bn           $11.6 bn         $10.4 bn                  62%               

You can see that CNA is big part of L, but it is getting smaller as other parts grow.  CNA has spun off Lorillard, sold part of DO etc... 

But CNA's holdings still account for 43% of L's market cap and 62% of value based on book value.


CNA Has Done Well in Past Five Years
So it seems like CNA has done well over the past five years, despite their large loss in 2008.  So why is CNA stock so cheap? Shouldn't it get at least book value per share for their outperformance?

To see what's going on, I looked at some other insurance companies.  For comparables, I just took the list  in their proxy statement and didn't include companies that didn't seem like it was in the same business (Ace Ltd is reinsurance, Allstate is mostly retail (auto and home-owners), Lincoln National is life etc...).


Book Value Growth (incl dvd) Since 2001

(CB = Chubb, TRV = Travellers, AFG = American Financial Group, HIG = Hartford Financial)

This is how other insurance companies have done over the past ten years compared to CNA.  CNA is the dark, fat line at the bottom of the chart.  You notice that CNA has done demonstrably worse than the other insurance companies and even underperformed the S&P 500 index (as we already saw earlier).


Book Value Growth (incl dvd) of Various Insurance Companies

So yes, CNA has outperformed the S&P 500 index over the past five years, but when compared to other insurance companies, it doesn't look so good.  It looks good compared to HIG, but that is not such a great comp. CNA underperformed even HIG over ten years.

Reading through the CNA annual reports over the years, I am struck at how often the management talks about the tough competitive environment and horrible pricing and things like that.   They also talk about awful economic environment and disasters that cost them money but these are things that other insurance companies had to deal with too.

Also, management often talks about how they have a great balance sheet,  great relationships with agents, are controlling costs and getting more efficient, focusing on more profitable business lines and things like that, but it's sort of been the same story since at least 1994 (read all of the letter to shareholders and you'll see what I mean (there are some LTS missing since they are not in some of the 10k's).

CNA is Cheap
CNA is certainly cheap at 0.65x book or some such.  But if you look at the chart below, CNA is sort of always trading below book value, and the subpar performance of the business is probably the reason for that.

CNA BPS versus Stock Price

During one of the L earnings conference calls, I think last year, someone asked Tisch what has the most potential upside in the coming year or two; what business has the most potential for value gains at Loews?  (kind of a similar question was asked at the Leucadia annual meeting and Steinberg didn't want to answer the question due to Reg FD).

Tisch responded by saying that CNA stock is really cheap so if that gets revalued, that would be an upside boost to L.  He also said that CNA will get hurt in a rising interest rate environment as they have to own bonds against their insurance reserves, but Tisch said that a stronger economy and improving business conditions in insurance would be a positive offset to that.

So let's see.  What is it going to take to get CNA back up to book value?

Since 1987, CNA has averaged 0.94x book.

Let's take a look at some other insurance companies:

Price-to-Book Value Ratio Comparisons

So we see that CNA has pretty much always traded much cheaper than the other insurance companies (excepting HIG; they are both in the doghouse now).

Obviously, the better performing insurance companies trade at a high p/b multiple.

Expected Returns
So we looked at historical returns of the various insurance companies (book value growth including dividends is the same as comprehensive income for this purpose.  Net income is not so great as realized gains go through the income statement but not unrealized gains, even when unrealized gains increase the value of a company.  Unrealized gains are booked in AOCI (accumulated other comprehensive income) and does change book value of a company.)

So we know that CNA is cheap, but it's cheap also because it hasn't done too well versus peers.

What is the proper value of CNA, then?

For this I was going to do a scatter plot, but realized that five companies isn't going to make a great chart, so I did something simpler.

Expected Returns based on Historical Book Value Growth (plus dvd) and P/B Ratios

In the table above, the average return is just the average growth in book values including dividends (my "comprehensive income"), the p/b ratio is exactly that, and the average expected return is simply the average return divided by the average p/b ratio.  If a company earns an ROE of 20% and you pay 2x book value for it, your expected return is 10%.

So the table above just shows the expected return based on average returns and valuations.  We see that the higher the comprehensive income return on equity, the higher the valuation.  It seems that even though CNA has been cheap averaging 0.7x book in the past five years, that is still not cheap when considering that it only earned an average of 4.4%/year.  So the expected return assuming a 4.4%/year return and paying 0.7x book is still 6%, much lower than the 12% you can earn on CB paying 1.2x book if CB continues to earn the average 14-15% comprehensive return on equity.

If CNA continues to earn 4.4%/year and we need to get expected return to 10% or more like the other insurance companies (except HIG), then CNA would have to trade at 0.44x book value.  This means that CNA may, even at 0.65x book, be 50% overvalued.

For reference on current valuations, here are the P/B ratios based on book value as of March-end 2012 and current stock prices:


                            Current     Current                 Expected return based on:                
             BPS        Price         P/B                        5 yr avg return     10 yr avg return
CNA    $44.48     $28.94      0.65x                        6.8%                   2.8%
CB       $57.37     $72.70      1.27x                       11.4%                  11.8%
TRV    $63.81     $62.92      0.99x                       14.0%                  14.3%
AFG    $45.65     $39.15      0.86x                       13.9%                  15.3%
HIG     $43.25     $17.40      0.40x                        -7.8%                  11.0%


This is the same table with current price and P/B ratios.  Assuming CNA can do as well as it has in the past five years, paying 0.65x book for it will yield an expected return of 6.8%.   So we see that unless there is substantial improvement in the operations of CNA (which is questionable due to the long history of promising comments from management with little improvement in 20+ years), it's hard to see how CNA can get valued much higher.

Paying a premium for CB and even TRV and AFT would yield higher expected returns.

There is a problem in using historical book value growth (or comprehensive returns on equity) as interest rates are very low now and many insurance companies still report investment income in their fixed income portfolios of 4-5% range.  This is because even though interest rates have declined substantially, it will take time for the old bonds with high yields to roll off and be replaced by lower yielding bonds.

But this applies to all insurers, not just to CNA.  So going forward, returns may be lower (unless conditions normalize). Even then, CNA will go lower from a lower base and could even make them unprofitable if rates stay here and the insurance operations keep going as it has been.


Underwriting History
OK, so let's just take a quick look at CNA's underwriting history.  There wasn't an easy way to get historical combined ratios and "float" figures (I didn't want to add up all the different things), so I just used a quick proxy for this.


Operating Profits Excluding Investment Income


So for a proxy of underwriting gains, I just used income excluding investment income (and some others).  I took net earned premiums and other revenues and then deducted "claims, benefits and expenses".  So that may not be the exact combined ratio or underwriting profit, but these figures were easy to pull out of the reports.

So we see that excluding investment income and realized gains on investments, CNA is pretty deeply unprofitable.  That's OK, many insurance companies run at underwriting losses over time.

The columns on the right is "Total Investments" and the column next to that is the operating losses excluding investment income as a percentage of Total investments.  Total investments include float and CNA's own shareholders' equity so is not quite cost of float.

But it does tell you how much the investment portfolio has to earn for CNA to be profitable.  The two basic income streams here is insurance operating profits and investment income.

So you see here that if interest rates continue to go down and investment income goes down, CNA can look a lot worse. 


Limited Partnerships
The other thing that may offer some upside to CNA is their investments in limited partnerships.  They do have $2.2 billion or so invested in them.  They are invested in 79 partnerships that breaks down into 81% hedge funds, 14% private debt and equity and others including real estate.

The hedge funds seek "gains from differentials between securities, distressed investments, sector rotation or various arbitrage disciplines".  46% of the hedge funds are in equity related strategies, 32% in multi-strategy, 19% in distressed and 3% in fixed income.

People have asked on conference calls who CNA has given money to and they won't disclose that.

Anyway, here is some data from their 10K's:


They have $2.2 billion in limited partnerships as of the end of 2011.  I don't think you can calculate the rate of return on these funds as we don't know the cash inflow/redemptions from these funds.  All we know for sure is the investment income that comes from the partnerships, and that is listed in the table above.  That comes to an average of 7.5% since 2001, but that probably understates the actual return.  In 2011, there was $560 million in undistributed earnings included in the $2.2 billion figure above.  I suppose you can calculate the change in undistributed earnings, but that isn't disclosed going that far back.

In any case, I think as a whole, these strategies would probably earn 10%/year over time.  So with $2.2 billion invested, that's $220 million or so in earnings.   Against $12 billion or so in equity, this would add almost 2.0% to pretax return on equity.  If these funds can earn 15% over time, that can add 3% or so to pretax return on equity.

But keep in mind that the above returns are already included in all of the historic return calculations of CNA.  To make it additive to what is already in the history, they would have to do that much better.

Having looked at a bunch of listed hedge funds and private equity companies and their performance, I wonder if they can earn high returns going forward.

I wouldn't want to lean on this to make the CNA idea work.   If the funds can do well, that would be a nice bonus if the rest of CNA can improve.  But these limited partnerships in themselves isn't a reason to get excited about CNA.

What is Loews Thinking?
So what the heck is Loews thinking with this thing?  It has performed horribly over the years. If you ask them, they will say that they own 90% so noone is more disappointed in CNA than them and noone would like to see them improve more than them.  They will say that they think about it all the time and work very hard in trying to turn it around.

As for selling CNA even at this nominally cheap price (but possibly very expensive depending on point of view), I can see Tisch saying that they can sell it, but cash is earning nothing right now and with CNA, they can at least be owning something that earns 4% at a 40% discount and in this environment that doesn't sound like a good sale.

Fair enough. 

(well, how about then repurchasing L stock with the proceeds?)


Thought Experiment
But I wonder if they can't sell CNA, take a loss and use it to offset a gain on a sale of DO and then buy back a ton of stock?

As of the end of March, 2012, the BPS of L was $48.96.  The sum of the listed entities plus net cash and investments of L was $45/share (this is based on the sum-of-the-parts in the 2011 annual report with the figures updated to March-end.  This excludes L's unlisted subsidiaries etc.)

So I will assume L sells all of it's CNA and DO.  The loss on the CNA sale will offset the gain on sale of DO.

In a conference call, I remember someone asking about the cost basis of L's subsidiaries and I think Tisch said that it is complicated and they haven't worked out the exact cost basis for each sub.

But here, I will just use a simple measure which may be totally off, but that's OK.  This is just a thought experiment and we're allowed some guesswork.

For DO and CNA, I will just use book value as the 'cost'.  Since these entities are consolidated, the book value shows the accounting value of the businesses.  If a business is sold above book, a gain is realized and if it is sold below book, then a loss is realized.  I don't really know much about tax and accounting in these situations but let's just assume that is a reasonable ballpark assumption.

Then if we now sell DO, L would get proceeds of $4.3 billion and a gain of $2 billion (because DO is trading at 1.9x book value). 

If we sell CNA now at current prices, L would get proceeds of $6.9 billion and a loss of $3.9 billion (because CNA is trading at 0.65x book value).

So the transaction above would cause a net realized loss of $1.9 billion pretax and cash proceeds of $11.2 billion.

Let's say further that this $11.2 billion was used to repurchase L stock.  I know, you're not going to buy $11 billion of L stock in one shot. 

Anyway, book value of L at March-end 2012 was $19.4 billion.  With a pretax loss of $1.9 billion, let's call that $1.2 billion net after tax, that brings L shareholders' equity to $18.2 billion.

So assuming $11.2 billion is used to buy back stock, the shareholders' equity would drop to $7.0 billion (loss and cash out for share repurchase), and number of shares will go down to 117 million shares ($11.2 billion can buy 280 million L shares at $40/share).

Shareholders' equity of  $7.0 billion and shares outstanding of 117 million shares would bring BPS to around $60/share.

That compares to the current book value per share of $49/share and sum-of-the-parts (excluding unlisted entities) of $45/share.

A big advantage would be that with a much smaller capital base of $7 billion or so, the universe of potential investments can be much larger.  After this hypothetical transaction, L would still have $3 billion of net cash and investments on the balance sheet.

OK, so this may not happen any time soon, and $60/share is not *that* exciting for such a drastic transaction.   Who's going to buy CNA?  DO?  Who's going to sell L?  But that is the potential value embedded in L (or one way to look at it).

I have juggled a bunch of numbers here on this thought experiment; I may have screwed something up but I think it gives a rough picture of what could be...

Synthetic Restructuring
We know that we can jump up and down all we want and say L should sell CNA, even at a loss and they won't do it (well, actually we don't know that they won't.  They just won't say what they are planning!). This is not to say that they are wrong. There are all sorts of other factors that must be considered, and I'm sure the Tisch's are thinking of all the best options for them and I can't imagine them making anything other than a rational decision (even though sometimes we on the outside can't see everything so can't understand things).

But here's an idea. If you don't like CNA, but think CB, TRV or even BRK is better, you can synthetically swap out the business: Just go long L and then sell short the amount of CNA that L owns, and then go long your preferred insurance company.   L has done very well over the years despite the performance anchor of CNA.  Imagine what would happen with a strong insurance company!

Of course, this is not without risk. There can be a sharp rally in CNA for whatever reason (deal, massive restructuring, sudden hardening of the insurance market etc...) and the L share price may not reflect dollar-for-dollar the increase in the CNA value.

Of course CNA can go up and your choice of insurance company can go down; that's what it seems like always happens on these kinds of ideas.

But the fact is, you can restructure CNA by yourself.

Conclusion
I do like L, and I really respect the Tisch family.  I have no doubt they will do very well going forward.  As for the discount to asset value, this has been the case for many years so I wouldn't get too excited about that gap closing any time soon.

If you own L, you have to believe that L will continue to grow intrinsic value per share over time.  I don't doubt that they will.

On the other hand, part of the reason why I looked so closely at CNA here is because it is so cheap.  I was thinking that maybe CNA on it's own would be a good investment or maybe even better than L.  Any turn in the insurance market, improving market and economic conditions may really boost CNA results and get it trading closer to book value.  

That's what I was thinking initially, but a look at the long term history of CNA has made me wonder about that.  It's true that they are doing a little bit better in the past five years or so (despite the jawdropping decline in book in 2008) but improvements at CNA have been promised before.

So I'm not as excited about the potential of CNA as I thought I would be after taking this deeper look.

I hope I am wrong, though, and hope CNA does turn around.  If interest rates stay low and investment returns start coming down as higher yielding bonds roll off, things can get quite ugly at CNA.  It's hard to imagine that they would be able to make up that lost income with underwriting gains given their underwriting history (not so good).

Of course, this concern about CNA can also be a factor in the discount to asset value for L as a whole.

I hope they figure something out.


Friday, May 25, 2012

CKH: Seacor Holdings Inc. Annual Report 2011

So this annual report recently came in the mail.  It's another great read; a no-nonsense manager that has a great long term track record etc...

But then as I was reading this, I realized it sits on a common thread of this blog recently (inflation, too much debt, dollar destined to go down, manage capital accordingly etc...), so I figured I'd make a quick post about this company.

I noticed a similar pattern here with SEB (Seaboard) so I decided to do the same thing: compare CKH with Berkshire Hathaway (BRK) and the S&P 500 over various time periods:

CKH Book Value Per Share vs.  BRK and S&P 500 (Total Return)

So check this out.  CKH book has grown very nicely and consistently since 1992 keeping pace with BRK and blowing away the S&P 500 index with dividends.  I'm not picking on BRK, of course; it's a great company.  But it's nice to compare capital allocation oriented managers with BRK since the S&P seems to be too low a hurdle (for some of these great managers).  And guess what?  CKH is not a financial stock!

Here is the performance table from CKH's 2011 annual report:


I love it when companies put the key performance figures in a clear table going all the way back like this.  It makes it easy to see how the company has done over time right away.  Of course, BRK and LUK do this and put it on their front page.

I do understand why most companies don't do this (because it would just make them look bad!), but I wish they did anyway.  It would save a lot of time so we don't have to go digging into old 10-K's to create our own tables.

Anyway, there are some points in the above table that may be misleading.  First of all, in 2010, CKH paid a $15/share dividend so the BPS looks like it went down 5.4% in 2010.  But that's just because they paid a dividend.  So the growth rates of book value per share is understated in the table.  Note that Leucadia too left out a spinoff in their table so understates book value growth (the spin or distribution reduced book value).

Also, the stock price here is adjusted retroactively for the $15/share dividend so the annualized growth rates reflect the dividend (and real return to investor), but the relationship between the stock price and BPS will be off because of it so you can't calculate the price-to-book ratio from the table (well, you can, but it will just be off a little).

So I adjusted for that in the below table that compares BPS growth for CKH, BRK and the S&P return:

CAGR Comparisons
Here are the comparisons (after adjusting CKH BPS growth for the $15 dividend) and with BRK added:

                                                CKH             BRK            S&P 500 (w/dvd)
CAGR (1992 - 2011)              +14.4%         +14.4%        +7.7%
CAGR (2001 - 2011)              +10.5%         +10.2%        +2.9%
CAGR (2006 - 2011)                +6.8%          + 5.1%         -0.2%

CKH has kept up with BRK in all of these time periods; 5 year, 10 year and 19 years. 

Here are the averages for ROE and pretax ROE (from the table in the annual report):

                                                           Pretax
                                      ROE             ROE                    P/B ratio
Since 1993:                    12.6%          18.8%                 1.33x
Ten year average:            9.9%          14.5%                 1.13x
Five year average:         10.4%          16.0%                 1.05x

So from the above, we see that CKH has earned an ROE of 10-12% over time and a pretax return of 15%-19%.    The P/B ratio is something I calculated by using stock prices adjusted for the split but NOT for the $15 dividend.

If the folks at Leucadia want to earn 15% pretax returns, then CKH at book value is a good buy for them, and if Buffett wants a 10% pretax return, then he can like CKH even at 1.5x book.  (Not that they will; I am just using some of their recent comments as valuation benchmarks, that's all...)

BPS at the end of March 2012 was $87.14/share, and the stock is trading at $86.75/share, just around book value.  So at this price, it should be interesting to LUK, and Buffett would be interested in this even up to $130/share (1.5x book for a 10% pretax return).

  (This may not be a type of business that Buffett would be interested in, though... )


OK, So Who and What is Seacor Holdings?
CKH is involved in offshore marine services, aviation services, inland river services, marine transportation services, emergency and crisis services, commodity trading and logistics, and harbor and offshore towing services.   The big businesses are the first three.

Offshore marine serves oil and gas drillers, primarily in the gulf of Mexico and increasingly internationally.  Aviation services also serves the oil and gas drillers, and inland river services is the barge cargo business in the U.S.

The last couple of years have been horrible for CKH as drilling in the gulf came to a halt after the BP disaster.  CKH booked some profits helping to clean up the mess, but business went down a lot in 2011 due to that.

Business is apparently finally starting to turn since the fourth quarter of 2011.

Charles Fabrikant
Fabrikant is the guy behind CKH which he founded back in 1990.  He is a no nonsense guy that clearly says that he is in the business of buying and selling assets.  He is no longer the CEO (gave up the post in 2010) but is the Chairman and wrote the 2011 Letter to Shareholders. 

In the 2010 annual report, he wrote:


Anyway, to get a feel for Fabrikant, I would recommend reading all the letters to shareholders going back ten years (or whatever is available at the website).  In fact, I would recommend people do that with any stock they buy; I bet people would tend to do better that way!  (I don't always do it either...)

In fact, if they made that into a law; that you can't buy a stock unless you've read all the annual reports for the past ten years, it would really cut back on a lot of waste (lawsuits etc...).  Of course, people would then complain that they wouldn't have time to trade so many stocks and react to every earnings announcement, economic data release, headline, fad etc...  Hmmm...


OIBDA *is* Free Cash Flow
At CKH, Fabrikant insists that operating income before depreciation and amortization is free cash flow.   He has said this before, but here it is in the 2011 annual report:


So then let's use OIBDA and cash earnings with Leucadia's 15% and Buffett's 10% return hurdles and see what values we can get.

First, here are the OIBDA and "Cash Earned" for the last five years from the annual report.  From the ROE and pretax ROE table above, we see that the five year average is not so far off from the ten and nineteen year average so a five year average should be a good 'normalization' of OIBDA and cash earnings (even though 2011 was a horrible year due to the GOM situation).

                                                     Cash                   Pretax
                     OIBDA                   Earned                Cash earned
2007             502                          505                     519
2008             499                          411                     486
2009             392                          367                     386
2010             572                          398                     549
2011             280                          191                     219             
average:      $449 mn                  $374 mn              $431 mn

Total debt was $1.04 billion and cash and near cash assets were $816 million for net debt of $226 million.  One can argue if all the cash can offset the debt etc...  But let's just keep it simple and see what happens here.  It looks like net debt over the past few years have been pretty small.

So using the OIBDA, since this is before interest expense, we have to use enterprise value.  If we want a 15% pretax return, then CKH would be worth $449 million / 15% - $226 million.  That's $2.8 billion.  With around 21.1 million shares outstanding, that's $133/share against the current stock price of $87/share.

If your pretax return hurdle is 10%, then CKH can be worth $202/share

"Cash earned" is after net interest expense and taxes, so we can just look at this versus equity.  So if your return hurdle is 10% after tax, that's $374 million / 10% / 21.1 million shares = $177/share.

Just to keep it apples to apples, I added taxes back to "Cash earned" to make it a pretax figure (the difference between this and OIBDA, of course, is that it's after other income/expense (interest), equity in equity method holdings and less minority interest).

So the pretax "cash earned" is $431 million.

The value per share of CKH at the 10% and 15% pretax return hurdles are:

                                                       CKH Value per share
Value at 10% pretax return:          $204/share
Value at 15% pretax return:          $136/share

Both of these are quite a bit higher than the current stock price in the mid-80s.

Having said all that, we have to keep in mind that whatever we think of this stock, CKH has tended to trade at around book value per share.


P/B Ratio of CKH Since 1992

Since 1992, the P/B ratio has averaged 1.33x, but in the most recent five to ten years or so, it seems to have average more like 1.1x.


Credit Rating Downgrades
CKH's credit has been downgraded by S&P from BBB- to BB+, but Fabrikant explains how CKH is actually in better shape now than in previous years.   He explains it pretty well in the LTS, with a final thought on the subject, 

"It was disheartening [and galling] to have our rating lowered, but if Uncle Sam's printing press doesn't support a Triple A rating, who am I to sulk?"


The Seacor Attitude
To really understand the mindset of CKH, there is a very good section at the end of the 2011 Letter to Shareholders that describes exactly what they hope to achieve.

Here are some 'snips':


Sounds familiar?  Sounds a lot like the Leucadia guys, no?  Is this an inflation play too?  And available at 15% pretax return?!   (No, I'm not trying to become LUK's stock broker or anything like that; just connecting ideas and themes to make it interesting).

And some more worries below, like LUK's annual report:


And finally, to tie it into the strategy being implemented at CKH:


Again, I am no big fan of theme investing or economic forecasting.  But like Steinberg said recently, when you have the wind at your back, that's good.  This is the kind of business you like to be in.

And CKH seems to sort of fit that bill too.

Anyway, as usual, I do own some of this and the annual report just happened to land on my desk; I read it and thought it fit the recent 'thread' on this blog so I wrote it up.

If you read this post, buy the stock and lose money, too bad.  This is not a stock recommendation!


Thursday, May 24, 2012

Deconstructing Sony: Some-of-the-Parts Have Value

OK, so this is a company I really, really would love to love.  I grew up with their products and thought they were great.  But things haven't gone well there.  

I've been short this stock for a while, but without too much research.  It was just a short on Japan in general and Sony's (SNE) total disregard for shareholders (for example, their CEOs have been quoted as saying that they will never exit the TV business because the engineers are very proud of their work!  What the heck kind of management would say something like that?!) and the typical, slow-moving, no-sense-of-urgency in general in corporate Japan.

Also, I kept walking around trying to think of U.S. television manufacturers and wondered if Japan isn't going through the same phase that the U.S. went through (Japan did to U.S. manufacturing what Korea and China are doing to Japan; only Japan refuses to admit it is happening).

Anyway, enough of that.   The stock is getting mighty cheap now so maybe it's not such a safe short.  Also, I see that SNE is starting to turn up in value screens as it is trading well below BPS and some have said it is trading cheap ex-cash and investments on the balance sheet (but this is assets in the consolidated Sony Financial Holdings, so you can't look at it that way).

So first of all, since it is cheap (and has been cheap) on a P/B basis, let's take a look at the long term trend in book value per share, ROE (I will just use return on beginning equity; EPS / BPS at the prior year-end) and see how the stock traded against that over the years to see if Sony even merits trading at BPS (it would have to have a 10% or more ROE to merit P/B > 1, right?).

It's a Sony

This is a chart of SNE's stock (in yen) versus it's book value per share since 1991.  The symmetry is nice, but we don't really want symmetry in a stock price.   Sure enough, the stock looks cheap here dipping far below book value for the second time since 1991 (this is just an annual chart so maybe it's not the second time, but...).

Here is a table of some key figures for SNE since 1991. 


Digital Nightmare


Wow, so this is pretty awful.  In the past 21 years,  Sony has only generated a doubt digit ROE *twice*.  Just twice.  OK, so let's be generous and throw in 1997 as 9.88% rounds to 10%.  But that's still just three years out of twenty one.

From this table, you can also see that SNE has not grown book value at all since 1991!  Of course, that's hard to do with such a low ROE.     OK, so they paid dividends.  But dividends only averaged around 1.1% on book value for the past 21 years, so a shareholder would have only earned around 1.2%/year over 21 years!  (That's not a typo; the BPS did increase 0.1%/year so 1.1% dividend to book + 0.1% = 1.2%/year return)

Value Destruction
Over different time periods, book value per share growth was as follows:

                                      BPS growth
Since 1991:                   +0.1%/year
Past five years:              -9.7%/year
Past ten years:               -2.4%/year

So SNE managed to lose -10%/year in book per share over the past five years and -2.4%/year in the past ten years.  That's really stunning given that's it's not even a bank, investment bank or in the housing industry. 

So judging from that, SNE stock certainly doesn't look worth book value per share.  Why would it be if they haven't created value in 21 years?

Let's take a look at ROE over that time.

ROE in the past 21 years has averaged 1.74%/year.  I just used return on beginning equity since SNE doesn't include ROE in their financial summary and I just pulled these numbers from there.  (It's very telling when management doesn't display ROE anywhere on the annual report!  It means they aren't even paying attention to it).

But it's been a rough couple of years...
OK, so we've had a near depression, spike in the yen and a huge earthquake/tsunami and other exogenous events.  Perfect storm after perfect storm.  Fine.  Let's then just look at the average ROE through March 2008; the year-ended March 2008 was a record year for SNE at the peak of the global economic bubble.

So if you look at the ROE over the years and stop at 2008, the average is still only 4%/year.   Is a business that can earn only 4% ROE worth book?  I don't know.  I wouldn't be interested in such a business.

Why is Sony So Cheap?
I hear this question sometimes, but I think the question is the reverse: Why was SNE so expensive?!  With this horrible record of ROE and book value growth, SNE stock still traded at an average of 1.9x book value for the past 21 years.  That's almost 2x book for something that returned 1.7% on equity over the years.    To me, the price is more reasonable now than what it has been trading at before, even BEFORE the 3/11 earthquake, yen spike to 80 yen/dollar, financial crisis / Lehman shock and all of that.

Sum-of-the-Parts
I tried to put together long term financials for SNE but it was a nightmare trying to put together a history of segment data revenues and earnings.  They seem to keep rejiggering the segments so it's a pain to get a continuous history of segments.  The Music segment used to be the Music segment and then Sony Music turned into Sony BMG, which was booked as an equity method holding and the domestic music business was put into "Other", and then Sony BMG bought out the other 50% it didn't own so it became a wholly owned subsidiary again so it's back to being the Music segment (and domestic music business is out of "Other" and back into "Music").  And then there was all that shifting around of games, consumer products etc... 

So I figured, forget it.  I will clump all the legacy SNE into "other" and then get a value for the other more discrete parts:  The movie business, the music business, and the financial business (at least these segments have been stable for the past five years).

It turns out that over the past ten years, these three segments pretty much made all the profits and the rest of SNE didn't make any money at all (or very little).

Since 2000, SNE earned a total of 1.87 trillion yen in operating earnings.    Of that, the above three segments earned:

                                   Operating earnings
Segment                     for past 10 years
Pictures:                     504 billion
Music:                        236 billion
Financial Services:      871 billion
Total:                       1,611 billion

Together, that's 1.6 trillion yen in operating earnings from these three segments.  Actually, the Music segment should be higher than that because at one point, part of the Music business was booked as equity method  income (Sony/BMG) and not reported as a separate segment (so it's not included in the above "Music").  The music business outside of Sony/BMG (domestic music etc...) was booked in the "other" segment which I didn't include in the above.

You can see that Financial Services alone earned more than half the operating profits at SNE over the past decade.

What, you thought SNE was a TV and game console manufacturer?

So let's take a look at the sum-of-the-parts of SNE, as maybe some-of-the-parts have some value (not that Japanese management would be interested in realizing that value in any way)

Sony Financial Holdings (SFH)
This one is easy as SFH is a listed stock.  We can let Mr. Market tell us what this is worth.  SNE owns 60% (261,000,000shares) of SFH.  It is trading at around 1,162 yen/share so it's worth 303 billion yen now.  

SFH U.S. GAAP Results

Just as a sanity check, here are the SFH results as reported in SNE's 20-F filings (2012 from the earnings announcement; no 20-F yet).

According to this, SFH can be worth up to book value as it does have a long term ROE of 10%.  It's not that consistent, though, and it seems the good years are based on profits on gains in convertible bonds when the Japanese stock market is strong. 

If SFH is worth GAAP book value, then SFH may be worth 500 billion yen instead of 300 billion yen based on the SFH stock price traded in Japan.   But then many U.S. life insurance companies are trading below book value too, so that assumption might not work in this environment. 

(Note:  SFH is consolidated so the above table results are for all of SFH.  Again, this is U.S. GAAP based so differs from numbers reported on the SFH annual report (based on Japanese GAAP).  The difference is beyond the scope of this single blog post...).   The minority interest is deducted below the line; Sony actually only has 60% of the above table figures.

  • Advice to SNE management:  The financial statements are horribly complicated due to the consolidation of SFH; it's a nightmare to read!  Sure, there is a separate balance sheet, income statement and cash flow statement if you dig into the 20-F in the back, but it makes all the other figures virtually meaningless.  Either spin-off SFH to simplify it, or take a look at GE's annual report and see how they separated out GE's industrial business from GE Capital so it's easy to read.  Given that SFH earned more than half of the operating earnings at SNE over the past decade, it's not too small to ignore and put in the footnotes anymore.

Pictures
I wouldn't know how to value a movie business, but some googling around gave me some hints.  One of them is that Dreamworks LLC (not the animation one, but the live action one run by Spielberg) was purchased by Paramount for 1x revenues.  Also, the NBC/Universal deal was valued at 10x EV/EBITDA (I don't know if that includes NBC too or was just the movie side, but a sum-of-the-parts analysis of VIA or some other company sited NBC/Universal's 10x EV/EBITDA to value a movie studio).  Also, another analysis used 12x operating earnings to value the film group of NBC/Universal.

So here are my reference points:  10x EV/EBITDA, 12x operating earnings and 1x revenues. 

(I won't use Pixar or Lions Gate as they seem to be very different (and expensive)).

Since the movie business is a hit/miss business, I'll use the past five years average for sales, operating earnings and OIBDA:

                                          Operating
                     Sales            income            D&A        OIBDA
2008             858                59                     9                68   
2009             718                30                     8                38
2010             705                43                     8                51
2011             600                39                     8                48
2012             658                34                     8                42
Average:      708                41                     8                 49
           
 (actually, the D&A of this segment wasn't in the earnings release for 2012 so I just used 8 as it seems pretty stable over the years).

So according to the above, Sony's picture business can be worth:

Method                        Value
1x revenues:                708 billion yen
10x EBITDA:              490 billion yen  (I used OIBDA)
12x op income:            492 billion yen

So the movie business is worth somewhere around 500 - 700 billion yen.

Music
The music segment, too, is hard to value.  There aren't a lot of comparables.  I think EMI was a disaster so I won't use that as a datapoint.   I think the Sony-BMG deal valuation is obviously a good starting point as it's the same business (even though the current music segment includes music business other than Sony-BMG; the domestic, Japanese music business etc...).

The Sony-BMG deal done in 2008 was priced at 4.2x OIBDA.  The other datapoint is Warner Music Group that was acquired in January 2011. The deal was valued at 7.7x EV/OIBDA (adjusted for one-time charges/costs). 

So the music business is worth anywhere between 4-8x EV/OIBDA.

Again, I will use a five year average since this business is also hit-miss driven:

                                       Operating        
                    Sales           income         D&A     OIBDA
2008            229             35                  7              42
2009            387             28                  10            38
2010            523             37                  13            50
2011            471             39                  12            51
2012            443             37                  12            49
Average:     411             35                   11           46

So according to the above, the music business is worth:

Method                    Value
4x EV/OIBDA         184 billion yen
8x EV/OIBDA         368 billion yen


Value So Far
So far here is what we have for some of the parts of SNE:

                                                         Low                   High
Sony Financial Holdings:                300 billion         300 billion
Pictures:                                           500 billion         700 billion
Music:                                              200 billion         350 billion
                                                      1,000 billion      1,350 billion


So these three segments together are worth anywhere from 1.0 - 1.35 trillion yen.

There is 719 billion yen of cash sitting on the balance sheet (excluding SFH), but not all of that is going to be available.   There is also 176 billion yen in "investments and advances", which is where the equity holdings are booked.  Historically, this held Sony-Ericsson and the LCD joint venture and maybe some others, but they haven't been profitable so I won't give it any value here (until I otherwise learn what value it may actually have).

Long term-debt is 749 billion yen, short-term debt is 400 billion and "accrued pension and severence cost" is 294 billion yen, so that's 1.4 trillion in total debt and accrued pension and severence cost.  There is non-current "other liability" too but I think that is tax related and may be offset by tax assets, so I will leave that out  (I deduct short term debt here too because it seems like that is often current portion of long term debt).

So, we have total asset value of the three segments we looked earlier of 1.0 - 1.35 trillion, cash (excluding financial segment) of 719 billion yen and 1.4 trillion of total debt and other liabilities (not total liabilities; just the accrued pension and severence).

If we are generous, like many valuation models are out there, we can give full value to the cash.  In that case, the "stub" value of the rest of Sony (games, TV, audio/visual, computers etc...) would be:

Three segments value:     1.2 trillion (mid-point of 1-1.35 trillion yen range)
Cash:                                719 billion yen
Total:                               1.9 trillion yen
less total debt and liab:    1.4 trillion yen
                                        500 billion yen

With around 1 billion shares outstanding, that comes to 500 yen/share.  So the above three profitable business plus cash less debt equals 500 yen/share.

With Sony stock trading at around 1,100 yen/share, the value of the rest of the businesses is 600 yen/share.

Is the rest of Sony worth 600 yen/share?  Remember, excluding the three segments (Sony Financial, Pictures and Music), Sony hasn't made any operating profits over the past ten years.

Also, remember this is being generous as we are giving full credit to the cash even though the businesses need some cash to run; it can't all be distributed out in a breakup. Some cash will go to the various businesses.


What About Spinning Off SFH?
So what about just spinning off SFH?  It's already listed so a spinoff shouldn't be too hard to pull off.  Since SFH earned half of the operating profits in the past decade, the SFH-less Sony would just look horrible.  I'm not even sure it can survive.  

Take a look at the table below.  I just put together some figures from the 20-F filings that show Sony excluding the Financial segment.

It's pretty ugly.

Sony Figures Excluding Financial Segment

How much would you pay for a business that has earned a -7.5% ROE over the past five years, -2.2% over the past ten and -1.8% since 2001?

And remember, this *includes* the profitable Pictures and Music segment.

Now you can sort of understand why Sony wouldn't want to spin off SFH.  What is left over afterward may not survive very long.

On the other hand, maybe the profitable SFH allowed SNE the luxury to do nothing over the years and have no sense of urgency or crisis.  If there wasn't SFH income to soften the income statement, maybe they would have more of a sense of urgency and do something drastic.

Obviously, since the movie and music segments too are profitable, selling those would only make SNE look much worse.  No wonder why they are in no rush to sell those businesses; they need the profits from the three good businesses to subsidize their bad businesses.

Total Liquidation
Judging from the above "stub" calculation, if you assume that the rest of SNE (other than the SFH, Pictures and Music segments) is worth nothing and you just sell everything and pay back short-term and long-term debt and the pension and accrued severence costs, you would be left with 500 yen per share; less than HALF of what SNE is trading at now.

But that assumes that you can shut down the rest of SNE at no cost, but that's not going to be true.  It would cost money to lay off workers (severence), shut factories, and there is no telling what the 1 trillion+ in product inventory is going to be worth.  I assume generally that current assets and liabilities fund each other (recievables versus payables, inventory versus trade payables etc...).

But in a liquidation, that is probably not going to be the case.

So at this point, I don't see any clear value for SNE as a whole, even though SOME of the parts or even many of the parts have great value.

Conclusion
So this is just a quick look, even though it took me a lot of time to go back and forth through all of these filings to figure some stuff out.  

I see that there is some great value here, but then there is a lot of debt too. 

It sort of does look hopeless to me, but I have no real view on the other parts of SNE's business.  I have no idea if Playstation 4 is going to come out and knock the X-box out of the game (like how Playstation put Sega out of business).  I have no idea if SNE's mobile phone business will do well against Apple.  I don't have a view on digital cameras, camcorders and things like that as I see it as increasingly commoditized.  This is the same with TV's and other AV products.

I get the sense that the Koreans are catching up much more quickly than the Japanese anticipated, and there really doesn't seem to be an answer for them.

Their computer business too, seems iffy to me. What is their edge? Can they do better than HP and Dell? How are they going to compete with Apple?

I would not be comfortable long this stock; there is just no clarity for me in how SNE can generate value here.  As I said above, just by looking at their ROE history, it's just not worth book.

Risk of Being Short
On the other hand, there is a lot of risk being short this down here.  One thing is that investors in Japan may look at book value as a valuation measure (I've seen it mentioned that way; that book value is fair value).  So positive sentiment in the Japanese stock market can take this stock up.

Also, foreign investors tend to buy SNE as a blue chip, core holding like IBM or Coke (well, actually I'm not sure but it sure does look like there are a lot of foreign owners). 

SNE has gotten hurt by the rapid rise in the yen, so a collapse in the yen that so many are calling for would lead to a big rally in all exporters in Japan regardless of 'real' future prospects.

And as we all know, in this world of technology, you just never know.  There was a time when people thought Sun Microsystems was dead (just before the internet boom and it made tons of money on that).  Of course, there is the Apple story and some others.

So a hit product or two can really change things but that's not something we can predict.

Anyway, at this point I think I will stay short this one for now.