Thursday, March 29, 2012

Bangladesh and Sri Lanka

OK, so I took a closer look at the Singer operations in Bangladesh and Sri Lanka  (this is a post-script to the Retail Holdings post).

Sum of the parts is a good and fine, but if the underlying stocks are overvalued or trading at silly levels, then it doesn't matter if something is trading at a 50% discount to the sum-of-the-parts (unless you can buy the parent and short the subsidiaries).

So anyway, I just wanted to take a quick look at Singer Bangladesh and Singer Sri Lanka to see if it is reasonably valued, not that I would know what stocks traded in these markets are worth.

All I need is for reasonable valuations, not something bubble-like and silly and I would be happy.

First, let's do the easy one.  Singer Sri Lanka has already published their 2011 annual report.  You can get it on their website and it's in English.  So this wasn't a hard one to do.  Singer Bangladesh is trickier as they haven't published their 2011 report yet even though the ReHo annual report shows 2011 full year sales and operating earnings.  Also, 2010 was an abnormal year for Singer Bangladesh as they booked a huge gain on a sale.

Singer Sri Lanka
Anyway, let's take a look at Singer Sri Lanka first.

Here is some historical data from their annual report.


Sales growth has averaged around 18%/year since 2002 and pretax profits have grown +24%/year.  EPS has grown +22%/year.  Since the end of the civil war in 2009, sales grew +35% in 2010 and 37% in 2011.  If this is a country specific issue (end of civil war), then this trend may continue and if so, Singer Sri Lanka can be worth quite a bit.

At year-end 2011, the p/e ratio of Singer Sri Lanka was 13x, but the price has come down to a recent 107 Rupees, for a p/e ratio of 10.6x.  That's pretty cheap for a company that has grown sales and earnings in the past decade with accelerating growth and with very good return on average net assets.

Of course, this is an emerging market so there are political and other risks that I can't quite quantify.  But if money starts moving back into emerging markets (money has been moving out recently since the financial crisis), I can easily see this trading at a higher multiple.

The average year-end p/e ratio since 2002 just so happens to be 13x.  (So the year-end 'mark-to-market' of Singer Sri Lanka on ReHo's books is not unreasonable at all).

So Singer Sri Lanka's valuation passes the smell test, at least the initial pass.


Singer Bangladesh

Here is the historical data for Singer Bangladesh, but only going up to year-end 2010.  The 2011 annual report is not out yet.  I will post an update when that comes out.  But for now, let's look at this one:


I just wanted to get a p/e ratio on recent earnings, but 2010 had a huge gain on a sale of a subsidiary and the 2011 figures are not available yet.

So first, we can just look at a normalized earnings figure for 2010.  In 2010, they had a gain of 1.8 billion Taka, so their operating profit excluding that would have been 470 million Taka.  Using a 27.5% tax rate, that's gives an after tax profit of 340 million Taka.  With 3.93 million shares outstanding, that's an EPS of  around 87 Taka.  The stock is trading at 2,180 so that gives a p/e ratio of 25x.

The average p/e ratio of Singer Bangladesh since 2001 has been 22x (excluding 2010 which had the huge gain and showed a p/e ratio of 8.2x).

So Singer Bangladesh is trading at pretty much where it always trades, with a high above 30x p/e and a low p/e of 11x (on a year-end basis).

For the first nine months of 2011, Singer Bangladesh had an EPS of 79.18, so just doing a simple 4/3 annualization of that gives an EPS of around 100, which would give a p/e ratio of 22x.

So on this basis, 22x p/e seems to be just about the average p/e for this stock since 2001.  Singer Bangladesh has grown sales 16%/year between 2001 and 2010, and as stated in the ReHo 2011 annual report, on a tax adjusted basis, sales grew 14% in 2011.

It seems that it is growing well along with the economy.

Conclusion
I just took a quick look at these entities that are the two big components of Singer Asia/Retail Holdings' value.  Of course, this is not meant to be an in depth look/research into these companies.  That would be difficult as the historical annual reports are not available and these companies do not file 20-F or 10-K's.

But even a quick look like this would give quite a bit more comfort than the usual sum-of-the-parts, "hey, this stock is trading for way less than the sum of their listed holdings!".

At least we know that things are not ridiculously overvalued or anything like that.

Anyway, I do intend to follow this as further details are announced (Singer Bangladesh's 2011 annual report etc...), so stay tuned.

Retail Holdings

Here's an interesting 'liquidation play' I've had for a while (paid $10/share or so a while back) but still might look pretty interesting.

Retail Holdings (ReHo/ RHDGF) is just a holding company that owns 56.2% of Singer Asia, which is just another holding company that holds shares in Singer Bangladesh, Singer Sri Lanka, Singer Pakistan, Singer India, Singer Thailand and some others.

There interesting point here is that most of these holdings are publicy listed themselves and Retail Holdings itself (ReHo) trades for way below the current market value of these entities. 

The Singer stores in these countries are basically retailers that sell white goods, consumer electronics and even motorcycles.  The two big ones are Singer Sri Lanka and Singer Bangladesh.

Retail Holdings just announced their 2011 results and the stock popped 20% yesterday.  Their annual report in the past couple of years has included the calculation of the market value of their underlying holdings. 

Anyway, I don't want to go into the detail of each company (you can look at annual reports of the respective companies or read the annual report for Singer Asia that summarizes it all.  The ReHo annual report too summarizes each company's results), but here is the gist of the play.

In the beginning of Reho's annual report is the mission statement:

  "ReHo's strategy is to maximize and monetize the value of it's assets, with the medium-term objective of liquidating the company and distributing the resulting funds and any remaining assets to its shareholders".

Sum of the Parts
The ReHo annual report conveniently breaks down the value at Reho if you sum up the market value of the listed subsidiaries as of December 2011.   The valuation takes into account three main components of Reho's value:  The value of the listed (and other) subsidiaries, cash held at Reho and the SVP Notes (notes from an entity that ReHo sold assets to).

The market value of holdings attributable to ReHo at December-end 2011 was $157.1 million
The notional amount of SVP notes $26.8 million
and Cash of $2.9 million.

This totalled $186.8 million. With 5.3 million shares outstanding, this comes to $35.20/share.

Here is the table for Singer Asia's holdings from ReHo's annual report (ReHo owns 56.2% of Singer Asia):


So even with the current stock of ReHo up to $21/share, it is trading at 60% of what it was worth at the end of December 2011.

I did a quick check on the holdings as stock market data is available online for Bangladesh, Sri Lanka etc...  

Using current prices, current holdings attributable to ReHo would be worth $128 million due to some weakness in some of these stock markets.   Adding up the other parts we get a value of $158 million.  And again, with 5.3 million shares outstanding, that comes to $29.80/share

So even with the decline in value of the holdings, ReHo is trading at 70%, or a 30% discount to the value of the underlying assets.


Singer Asia For Sale
We know, because ReHo has said so many times, that Singer Asia is for sale.  There was an article in the Sri Lanka Daily News back on September 8, 2011 that said "Singer Asia for sale for U.S. $350 million".  The article sited a source that said Singer Sri Lanka is worth $200 million and Singer Bangladesh is worth up to $120 million.  It said that the other parts, Pakistan, India and Thailand are too small (to make a difference in total valuation).

If Singer Asia was sold for $350 million, that would be worth $197 million to ReHo as ReHo owns 56.2% of it.  With 5.3 million shares outstanding, that comes to $37/share versus the current stock price of $21/share.

Of course, just because a local newspaper said that Singer Asia is for sale for a certain price doesn't mean it will get sold at that price or even that it will get sold at all.

But what makes this idea really interesting, actually, is the operating momentum at the companies.


Fundamentals
Here is the consolidated revenues of Singer Asia:


Thailand is in blue because it's not a consolidated subsidiary (equity method holding).  The sales amount attributable to Singer Asia was added back to show the underlying trend in the owned businesses.

You can see the revenues slowed or reversed during the global financial crisis and is gaining momentum as the economies recover. 


Singer Sri Lanka

From the above table, we see that $126 million of the $276 million in value is in Singer Sri Lanka.  Sri Lanka is not a particularly large country (population of 20 million or so), but what is really interesting is that Sri Lanka may be operating under it's own dynamic; the civil war ended in 2009 and economic growth has really taken off since then with back-to-back years of economic growth above 8%/year.   If this trend continues, this can really add some value to ReHo.  It may also interest some serious buyers for Singer Asia, either as a whole or parts of it. 

Sales for the group (Sri Lanka) grew +40% and operating profits grew +50%.

Part of the delay in liquidiating Singer Asia/ReHo has to do with the global financial crisis, but if the economies start to normalize and this sort of operational momentum continues, then a sale at a pretty decent price is not a total stretch.

As of December 2011, I think Singer Sri Lanka was valued at 13x or so p/e ratio, so it wasn't expensive by any means.

I may post something about these separate subsidiaries in a future post as I think it is very interesting to look at.

Singer Bangladesh
This is the other large piece of Singer Asia.  Earnings-wise, it's not doing as well as Sri Lanka (as far as momentum is concerned), but sales seem to be growing at a nice clip.


Sales grew +5.4%, but if adjusted for a difference in accounting for local taxes, sales grew +14%.


Singer Thailand
Singer Thailand is small, but larger than India or Pakistan in terms of market value.  Thailand also seems to be turning around and growing revenues.


So ReHo is certainly looking pretty interesting even if the value of the public holdings are down 20% or so year-to-date. 

If this operating momentum continues, the value of the subsidiaries may increase and buyer interest may emerge to make possible a liquidation.

Other Issues
I have read some other analysis on ReHo as a sum-of-the-parts/liquidation play, but none of them really focus on what would happen if Singer Asia is not liquidated.  If that is the case, then the $2 million or so in compensation and other costs have to be capitalized and deducted from the value of the whole; the sum of the parts don't include a deduction in these expenses 'below the line'.

Also, I have an email out to ReHo, but I wonder about the license/royalty fees paid to SVP Holdings.  ReHo sold the rights to the Singer name back in 2003 or so and Singer Asia has to pay 1% of consolidated sales as a licencing fee to SVP every year. 

I looked at the notes in the annual reports for both Singer Bangladesh and Singer Sri Lanka and I don't see an item for this royalty.

If the listed subsidiaries do NOT pay this royalty to Singer Asia but Singer Asia DOES pay it out, then this 1% of sales cost is not deducted from the sum-of-the-parts valuation using the market values of the listed subsidiaries.

I was wondering if the listed subsidiaries in fact pays these royalties to Singer Asia in some way.  If not, then this 1% has to be deducted from the sum of the market values of the listed entities.

I will look further into this issue as it can have a large impact on the value of Reho (even though it would reduce the discount).

[ Since posting this, I have learned that Singer Asia does in fact get paid royalties/licences from subsidiaries and others and those payments received by Singer Asia are larger than the amount paid out by Singer Asia, so this is a non-issue.  (This comment added on April 2, 2012) ]
In a later post, I will take a long term look at Singer Sri Lanka and Singer Bangladesh from their annual report and will make an update post on the licensing fee/royalty issue if I get an answer from ReHo.

Risks
This is certainly an interesting play but there are risks, of course.  This a Curacao based company (not U.S.) and is only listed on the pink sheets so it is not very liquid.  I don't have a good understanding of Curacao corporate law or laws regarding shareholder rights (not that I have a good understanding of that in the U.S. either, but...).

I don't follow and haven't followed the economies/politics in Bangladesh and Sri Lanka so I can't say I have a good feel how these economies would react to an implosion in the Chinese economy, slowing Indian economy and things like that.

These companies are in emerging, if not frontier economies and things tend to be volatile in this area so I would not feel comfortable with too large a position here. 

This idea is certainly not for everybody. 

As usual, do your own work!


Tuesday, March 27, 2012

What's Important

Goldman Sachs published a lengthy report recently saying that the stock market is a buying opportunity of a lifetime.  Of course, the bears are out tearing apart the argument piece by piece.  I've read the report and some of the very well articulated counter-arguments.

First of all, some are laughing at Goldman Sachs' report saying that it's a bit late in the party after stocks have doubled from the 2009 low.  Others treat the report as a total fantasy and has no basis in reality.

But it's important to remember that Warren Buffett has been saying the same thing for a while now and has repeated it again in his annual report this year.  If you asked Buffett if stocks is a good investment, he would tell you that it's a no-brainer at current levels.

Anyway, both sides of the argument have very good tables and charts to make their cases and they are very interesting reads.  I do like to read both sides of arguments.

But I think it's also important to remember that these bull/bear arguments have been going on forever.  At any given point in time there will be people calling for a bull market and others calling for a bear market.  And usually, the bear market proponents have the more convincing presentations.

But Does it Really Matter?
I don't want to brush off warnings of an overvalued market.  Japan in 1989 was certainly overvalued by any measure with just about everything overvalued.  In 2000, U.S. stocks were overvalued, but I would argue that the whole market was not overvalued.    There were plenty of reasonably priced stocks if you stayed away from technology, internet and some overvalued Buffett-esque blue chips (like Coca Cola).

We can spend a lot of time looking at these bull and bear arguments, adjusting our portfolios according to who we agree or disagree with, but I tend to think that's a bad idea. 

This would be what people call "market timing" and I've wrote about how that's usually not such a good idea  (read here).

I wrote a recent post about profit margins (bears argue that since they are way above historical averages they must go down) and high valuations (valuations using 10 year average EPS is way above historical averages so must come down).

My argument is not so much that the market won't go down or margins won't go down or anything like that.    The main point is that if you own stocks that aren't expensive and don't have way above average, unsustainable profit margins, then one shouldn't worry too much.

If you look back at how wealth has been created in the stock market, especially if you are a value investor, much more value is added by stock-picking than by market-timing.

I admit this is not a fair argument as I will use as examples very successful value investors and most of us won't come anywhere close to achieving this sort of success.    But then again, we have to measure that against our potential to be able to time the market in and out better than, say, George Soros.  Just because we can't be great value investors doesn't mean we can become a better George Soros!

Buffett
Warren Buffett has a great historical track record.  There's no need to cut and paste any performance figures here.  But his great wealth was not created by timing the market; selling when the market gets expensive and buying back in when some academically calculated p/e ratio gets to a low level. 

His wealth was created by picking great stocks, concentrating his investments in them and then holding on to them for a long, long time; not getting out when academics screamed, "The market is overvalued!!"

He ignored all such prognostications and focused on what he thinks he understands and knows.  It's very simple in concept but pretty much impossible for most 'normal' people to follow (greed and fear get in the way).


Greenblatt
Here's another example.  Anyway, I've posted this table before.  These are the performance figures for Joel Greenblatt's fund which was primarily long only (except for some special situations that might have required short selling, like stub trades).

Return
1985 (9 months)   +70.4%
1986                     +53.6%
1987                     +29.4%
1988                     +64.4%
1989                     +31.9%
1990                     +31.6%
1991                     +28.5%
1992                     +30.6%
1993                     +115.2%
1994                     +48.9%

He made 50%/year between the years 1985 and 1994.  This is totally astounding.  And what's really important to keep in mind here is that he didn't make these returns by buying stocks when the p/e ratio of the S&P 500 index was below x and then selling it when it got above y.  Nor did he achieve this by buying stocks when the profit margins of U.S. corporations were way below average and then selling them when they were way above historical averages.

How he made these returns is explained in his great book,  You Can Be a Stock Market Genius.   He evaluated each investment idea on it's own merits and put trades on when they made sense.  He didn't shut down and go to cash when he thought the stock market was pricey.

Notice his performance in 1986, and even 1987, the year of the crash.  Many people were afraid of equities after the 1987 crash and stayed away for years only finally coming back in the late 1990s.  But Greenblatt made 64% in 1988, 32% in 1989 etc... 

He didn't sit back in 1988 and say, "well, I see a lot of wonderful ideas but I'm not going to touch stocks because bear markets don't end until the market p/e gets down to 7 or 8x like it did in 1932, 1974 and 1982.  (I do remember a *lot* of people saying that!  They said it again in 2009, that bear markets don't end until the p/e ratio gets to 7x or 8x.  Oops again!).

He just kept doing what he did regardless and kept making money.

He focused on what's important and what's knowable and ignored what's unknowable (direction of the stock market).


Superinvestors
I've used this table before too for a similar post not too long ago (read here).   These superinvestors (so named by Buffett in an essay he wrote in the early 1980s) also ignored all the warnings against stocks.  Interestingly, the warnings pretty much all came true and yet these value investors managed to do very well just buying cheap stocks as they have done before.  They stuck to what they understand, dealt with facts that were knowable and ignored the rest.

I don't have to list up all the problems that the U.S. went through from the late 1960s into the early 1980s.  It was a horrible time and you can imagine what the newspapers, magazines, investment strategists and academics were telling people about stocks at the time.

But look through the below table carefully, year by year and think about what the headlines looked like at the time, and think that these folks were just sitting in their offices doing what they always did.  They didn't use options to hedge their portfolios.  They didn't buy treasury yield increase warrants and pile into gold or gold stocks.  They just did what they always did.

How many people dumped stocks and piled into gold in this era and then continued to do well in the next decade and the decade after that?   These superinvestors continued to do well after 1982 (they did outperform the S&P 500 index for many years after).


But What if You Just Owned the Index?
OK, so many people just own an index fund.  What about them?  They won't outperform and those valuation charts may be relevant to them as they can't avoid the overvalued sectors like Buffett, Greenblatt and the Superinvestors.

This is true.  But again, over time, the index does tend to do well as long as the U.S. economy keeps growing and companies continue to make money. 

There will be periods of flatness like there was after 1929, 1965 and now after 2000.  But that doesn't mean one shouldn't own stocks.

Even if you bought stocks in 1986 or 1987 (year-end) which were consided bubble years back then and the end of U.S. capitalism and dominance was at an end, your total return through the end of 2011 would have been 9.3% - 9.5%/year.

There was a lot of bear talk back in 1987 after the crash and projected equity returns were probably pretty low (due to the stock market having the highest valuations since 1929), but if you bought stocks in December 1987 (S&P 500 index), your total return for the next ten years would have been +18.1%/year.  And as I said, through December 2011, you would have had a total return of +9.5%/year.   (I tried to get total return figures from the high in August 1987 but couldn't find the data; the returns would obviously be lower but it still wouldn't be too bad even buying at the top).

Don't forget, back then, after the 1987 crash, people thought we were headed right into a 1929-1932-like depression.  In 1988, bookstores were filled with books about the end of American dominance etc...  Japan was going to take over the world.

Wall Street was supposed to be finished.  Banks were all going to fail.  The market was supposed to go down 80% or 90%.

Oops.

So much for projections and forecasts.

I have to admit that I was also 'afraid' of stocks back then.  All those charts and bear arguments were very, very compelling.  They made a whole lot of sense and there really was no arguing against the facts displayed in the historical data (high p/e ratios etc...).


Conclusion
So anyway, these bull and bear arguments are fascinating to me and I love reading that stuff.  I also want to keep my eyes open for potential problems down the line.  I don't want to be a perma-bull and say stocks will always go up no matter what.  They won't. 

But I do think that it's important to stay focused on what's knowable and not get too caught up in whether we are in a new bull market, old bull market, new bear market or old bear market. 

Who cares?  These labels tend to be put on after the fact.  Nobody really knows beforehand, of course. 

I still think the most important thing is that we understand what we own, their business models, their valuations etc...  


Friday, March 23, 2012

Taking a LEAP into BAC

So I did mention that I bought BAC (Bank of America) LEAPs earlier this month.  I am a big fan of financials at these prices but haven't been the biggest fan of BAC. 

Goldman Sachs (GS), JP Morgan (JPM) and Wells Fargo (WFC) are much better managed, much solider firms and are very cheap (especially GS now more than the other two).

Brian Moynihan who is running BAC now has nowhere the credibility and track record of Jamie Dimon or many other financial CEOs.  

But the stock is certainly cheap so I decided to take another look.  There are a lot of unknowns here, as usual, most importantly the representations and warranties problem in their mortgage business and of course the continuing question of whether the economy will recover.

Here are some pages from BAC's investor day presentation in March of 2011. I am mostly interested in what they think they can earn in a 'normal' environment and see what the stock valuation is assuming they are right.

I don't think these estimates are unreasonable as long as the economy continues it's recovery. 


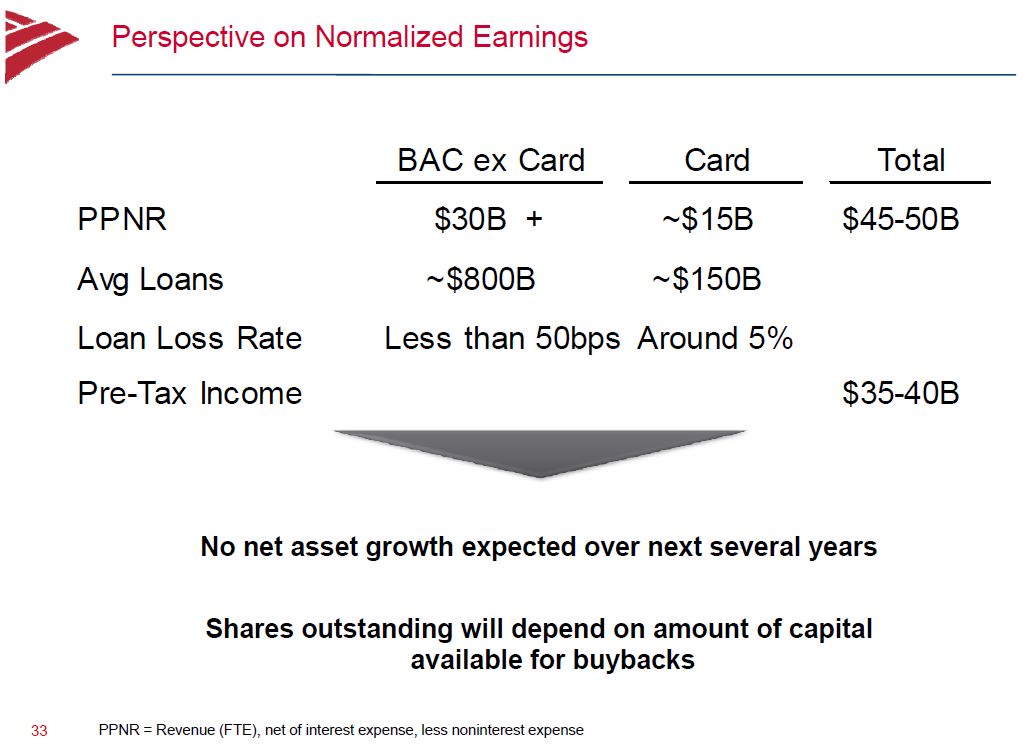
Much of the normalization in earnings will come simply from loan losses coming down from the very high levels today.   So with no asset growth at all and loan losses coming down to more 'normal' levels, BAC can expect to earn $35-40 billion.

That would be $23 - 26 billion after tax.  BAC had 11.2 billion outstanding at the end of December 2011 (actually 10.5 billion but I assume 700 million shares from the Buffett warrants are exercised as they are in-the-money (exercise price is $7.142857), so that comes to $2.05 - $2.32/share EPS.  Put a 10x multiple on that and you are looking at a $20.40 - $23.20/share stock price for BAC.

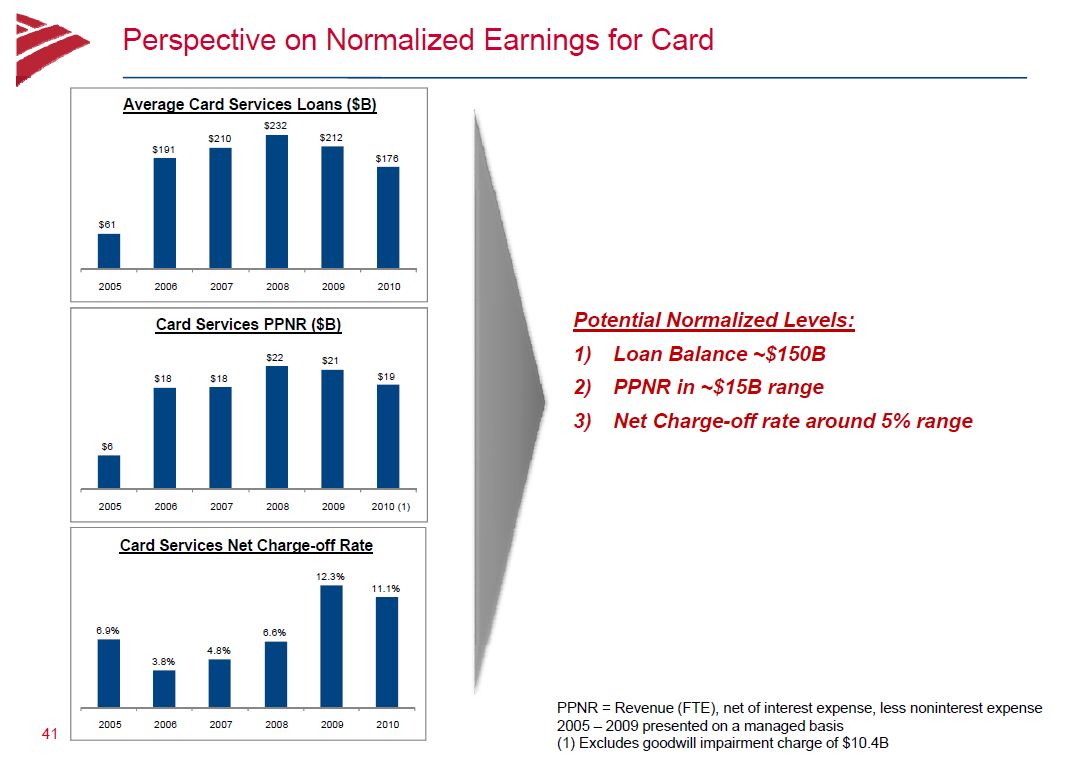
To get a feel for what loss rates were at BAC recently, here are some slides from the same presentation:


So it looks reasonable to assume losses will come down to more normal levels as the economy recovers.  Credit trends continued to improve in 2011.

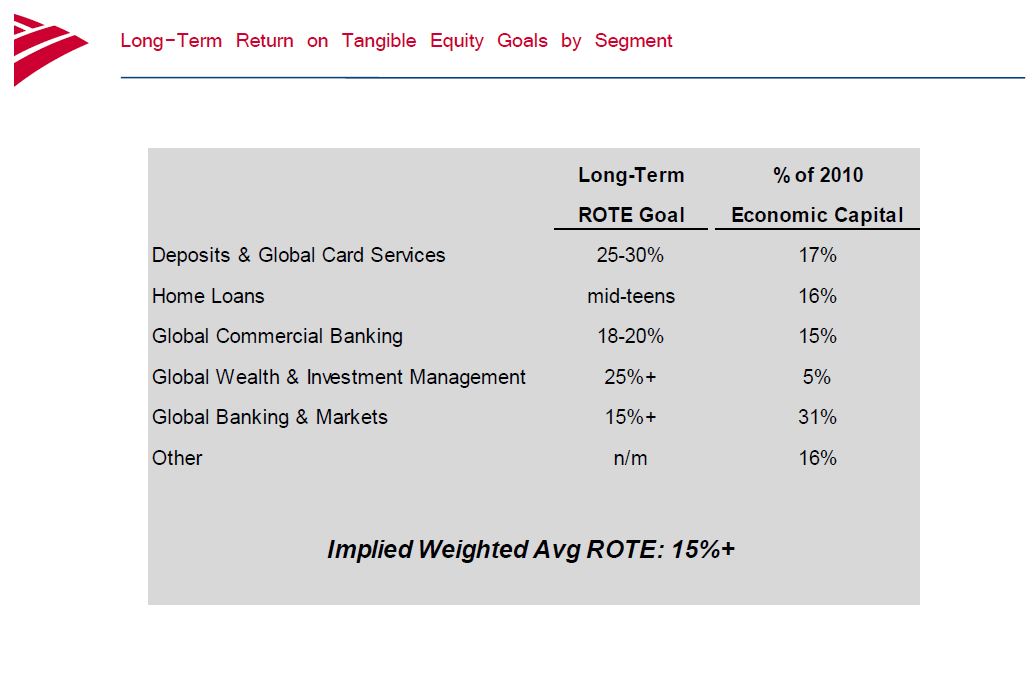
Here is the breakdown of their expected, or target ROTE (return on tangible equity):


From this, it seems that they  (like JPM) see at least 15% return on tangible equity as doable.  If they do 15% return on tangible equity, then BAC would be worth 1.5x tangible book.  Tangible book value per share of BAC as of the end of December 2011 was $12.95/share.  1.5x that would take us to around $19.42/share stock price.


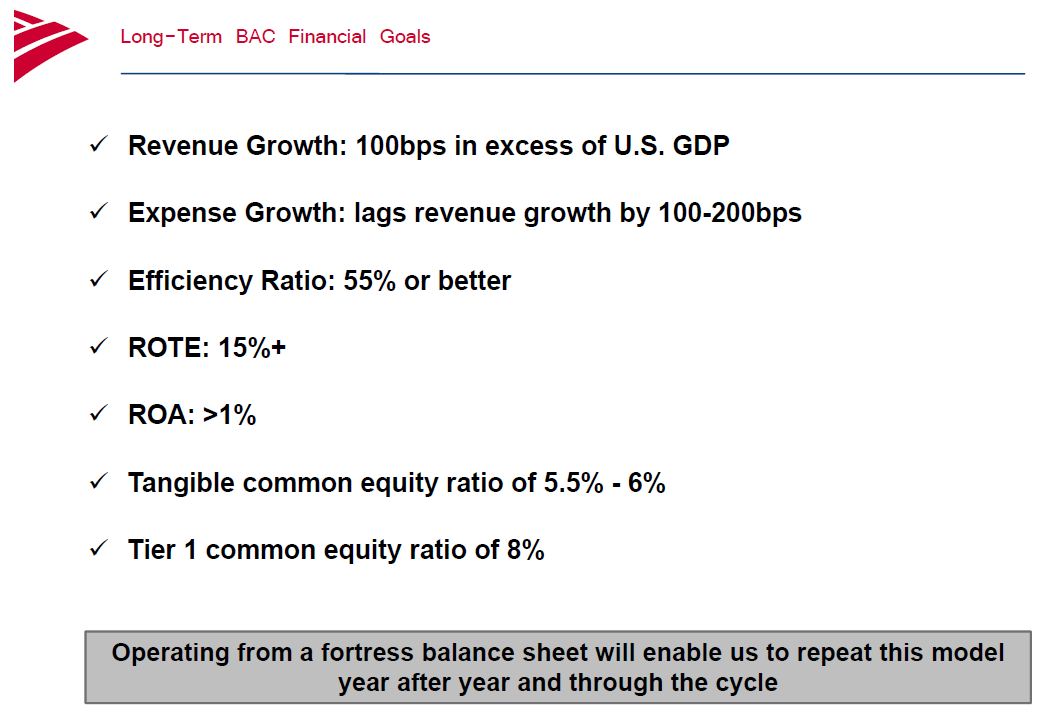
This chart shows what BAC thinks they can achieve over time.  The 'simple' way to value bank stocks these days seem to be based on a ROA level, multiply that by total assets and divide by the number of shares.  Of course, this is very simple and doesn't capture everything but when there is so much uncertainty and unknowns, it's not a bad place to start.

At the end of December 2011, they had $2.1 trillion in total assets.  1% return on that give us $21 billion.  With 11.2 billion shares outstanding that's $1.90/share in potential, normalized EPS.  Put a 10x multiple on that for a $19/share stock price for BAC.

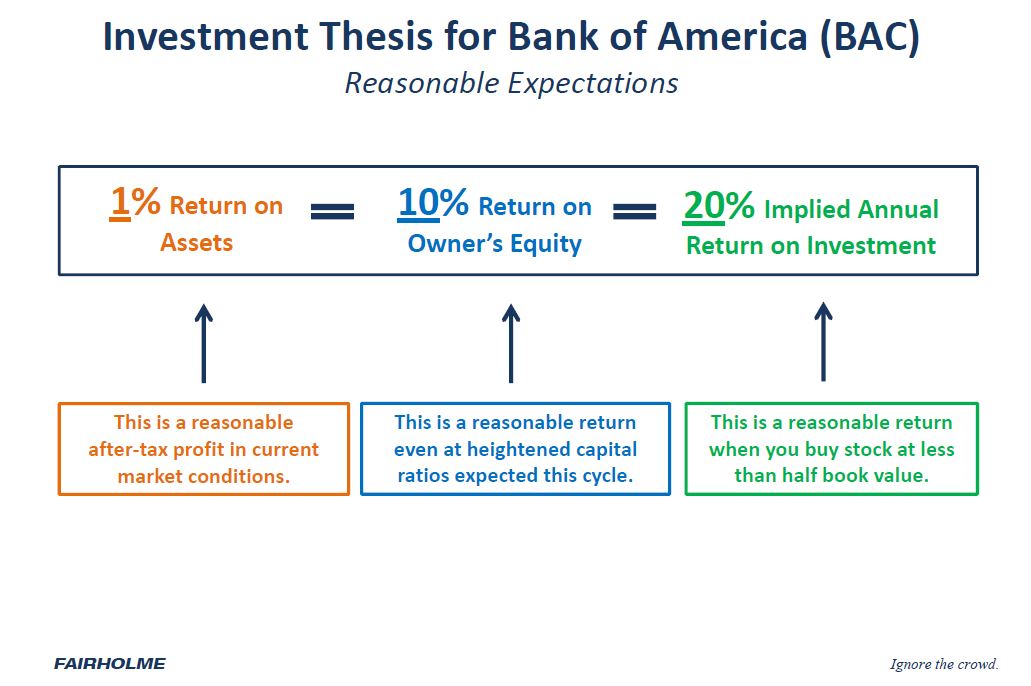
Bruce Berkowitz of the Fairholme Funds also has been a fan of BAC recently and has posted an analysis at the Fairholme Funds website which is worth flipping through.

Here are some snips from that:

Although I don't have as strong a feeling for BAC's management as I do with GS, JPM and WFC, Buffett seems to like them.


He does own preferreds and warrants on BAC so he really believes BAC is a good business and a lot of upside potential.

Here is the basic model Berkowitz uses for BAC, which is reasonable:


This is basically the same as what BAC management is saying.  BAC management uses 15% return on tangible equity but it turns out that would translate pretty much to 10% return on equity.

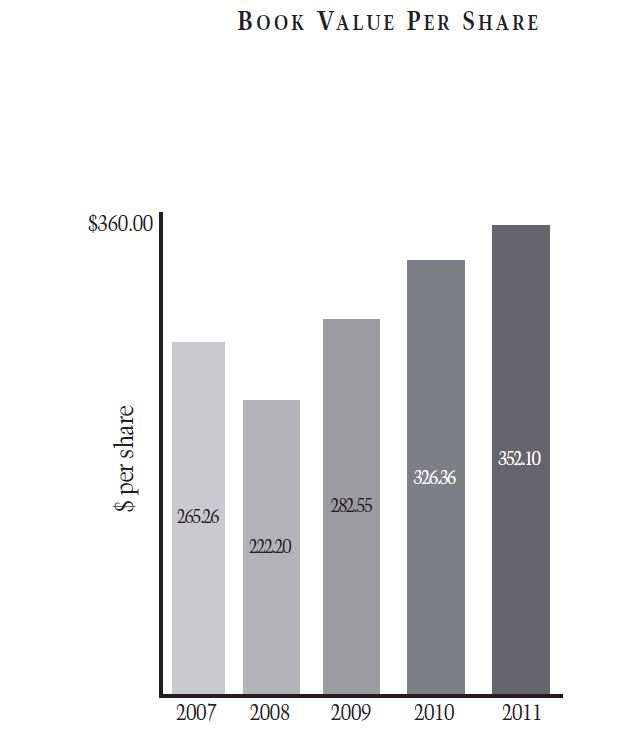
At the end of December 2011, book value per share of BAC was $20.09 and tangible book value per share was $12.95.

I bought the LEAPs when BAC was trading around $8.00/share, but even at the current price of $9.83/share, BAC is trading at 0.76x tangible book and less than 0.5x book.


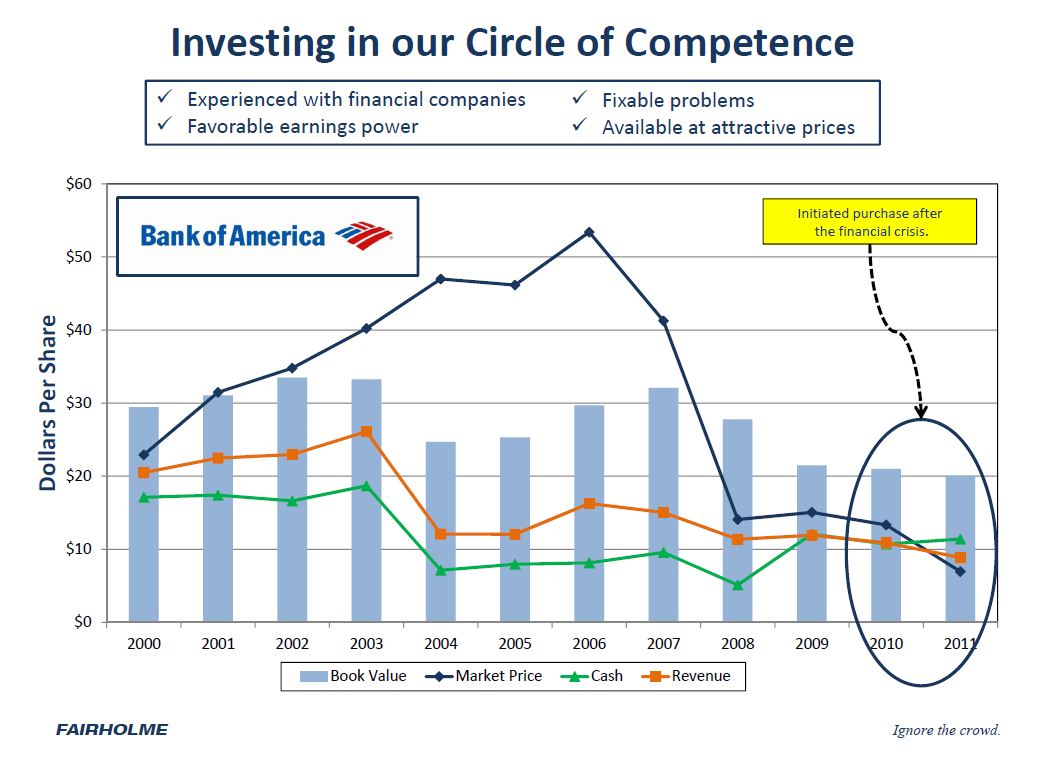
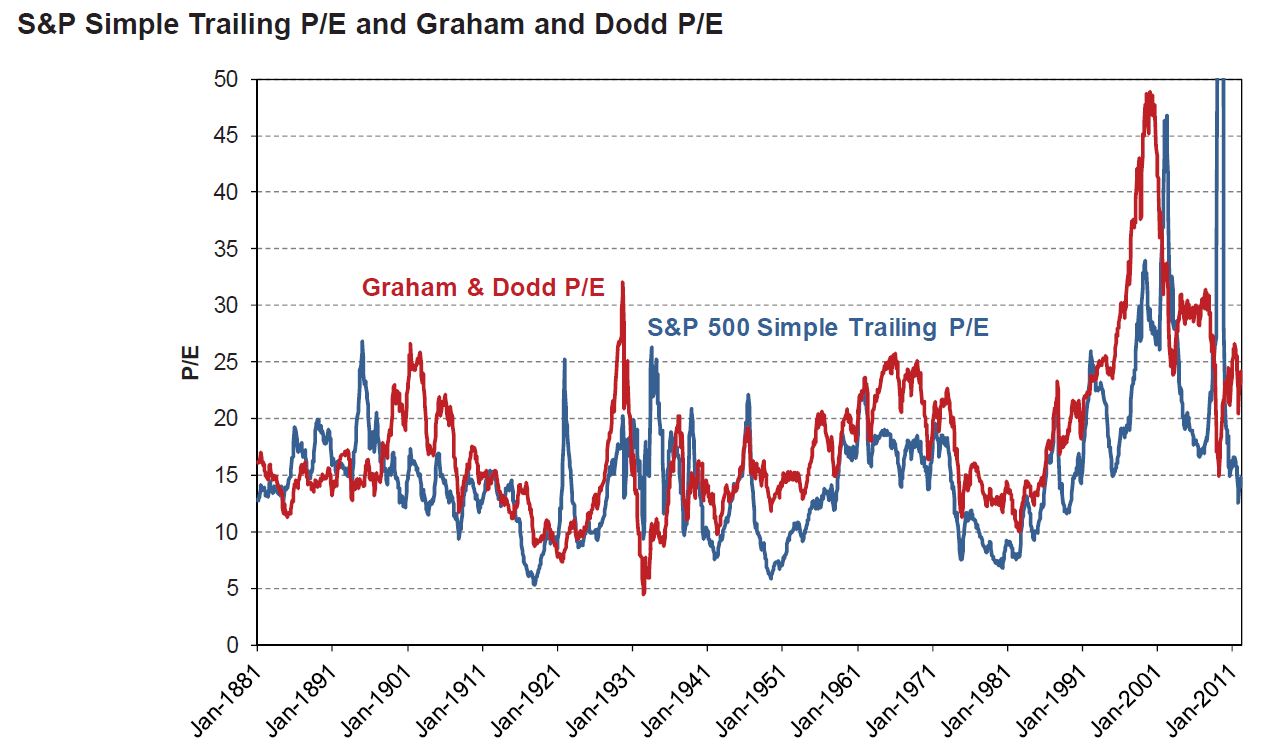
The chart below shows the tragedy that is BAC in the past few years, and what might be a great opportunity going forward.


The following table is a little outdated as BAC now is up to 0.5x book, but it is still pretty cheap.  I don't know if banks will ever get back to 1.83x price/book that is the 15-year history, but I think many of these financials will get back to book value and maybe higher depending on how the economy unfolds.

Representations and Warranties and Other Legal Exposure
There are plenty of risks with BAC, of course.  The above is a pretty clean scenario where things work out OK for them; no big boom in the economy or strong asset growth, but no big disasters either like another downleg in the economy or housing markets or worsening in the mortgage legal problems.

For the Reps and Warranties, BAC has reserved $15 billion or so and they think that if things worsened there can be $5 billion more.  So BAC and the street basically sees $20 billion or so at most in this problem. 

If that is the case, this won't be a big issue going forward as $15 billion has already been reserved.  It looks like there is activity on some sort of settlement in this area.

The other point is what Dimon has said several times in the past.  Even if things don't work out too well with these legal issues, it will take years to play out.  We're not going to see some sort of big settlement or problem where billions will have to be paid out immediately. 

So it is possible that the market fears this too much and sees it as an immediate liquidity/capital issue if the legal risk increases for whatever reason.

The risk here in a sudden worsening and need to raise capital due to these legal issues is basically seen as an equity dilution issue; how much stock would they have to issue to raise enough capital for an adverse legal development?

Perhaps pollyannically, I tend to think that the pressure is on for some sort of settlement.

But this is certainly a risk, as is the economy and housing markets despite things looking quite a bit better now.

Stress Test
The Fed released the results of their stress test and BAC passed this time with no problem, mostly because of their conservative capital distribution plan (versus Citigroup which failed due to a more liberal capital distribution plan).

The markets obviously were nervous about the results of this stress test.  The rally in bank stocks after the release shows just how worried people were.

I do tend to think the stress test was pretty harsh.  Of course, things could get *worse* than any stress test, but that stress test was pretty tough;   unemployment going up to 13%, stock prices dropping 50%, housing prices declining another 20% or something like that.

One thing to remember, though, is that firms like GS, JPM and WFC (and many others) came through a 'real' stress test in the crisis and came out just fine. 

I tend to think that BAC would have had no problem either if they didn't buy Countrywide at the worst possible time, and of course Merrill Lynch that almost took them down.  Without those two acquisitions, despite having been a huge bank with a lot of exposure to housing, they would have been fine.

Net Interest Income Risk
Of course the other big risk that applies to all banks is the continuing low interest rate environment.  It seems the healthy banks are making decent spreads so things are still fine at this point, but if the economy continues to be weak and housing doesn't recover, interest rates can remain low for an extended period of time putting pressure on interest spreads.  Japanese banks have interest spreads of less than 2% and that's why it's hard to value them for more than book value. 

This is a risk in the U.S., but I tend to think that the U.S. will do a little better than Japan due to demographics and other favorable factors. 

I know people keep saying that so it's good to be skeptical.  Who'da thunk the Feds Funds rate would be zero?  If you told people in the year 2000 (I did) that U.S. long rates can go to 2.0% or even 1.0% like in Japan, people would have laughed at you (they laughed at me, even though I didn't really predict this financial crisis or housing bubble/collapse).

I do tend to believe the housing market will normalize at some point and won't be flat on it's back forever, which makes me more comfortable with financials.

Maybe the housing market will be a future blog post.  

The LEAP Trade
The economics don't look as interesting as when I put the trade on, but it's still pretty interesting.  Let's take a look at the January 2014 10 strike call option, for example.  It's now at around $2.25/option.

Over the next two years, if the housing market starts to recover and there is a bit more clarity on BAC's legal problems, it's not a stretch at all to see BAC trading at book value of $20/share or 10x a 'normalized' earnings of around $2.00/share. 

In that scenario, this LEAP would be worth $10.   If this happens before January 2014 and the stock price gets to $20 before then, the LEAP would be worth more than $10/share (even though it might not have much of a premium due to it's high in-the-moneyness).

If things don't improve and we muddle along and there is no improvement in anything and the stock is stuck around $10 or lower, this option is worth zero.

So let's say there is a 50%/50% chance that things start to normalize over the next year or two.  I think the likelihood is actually much higher than that.

But at 50%/50%, then the LEAP is worth: 

   50% normalizing economy/markets: LEAP is worth $10
   50% normalization doesn't happen, or a total disaster happens:  Leap is worth $0

The expected value of this LEAP is $5/option.

If you change the odds to 75% chance of normalization within the next two years versus 25% of no improvement or total disaster, then the LEAP is worth $7.50/option.

So you are paying $2.25/option for what might be worth $5.00 - $7.50/option on a probability weighted basis.

Of course, this is way oversimplified, but this is the binary way I would look at this.

Also, it's important to keep in mind that the housing markets and economy doesn't have to recover or normalize by January 2014.  All that is needed is for the market to have some comfort that this will happen at some point in the near future.  Once they get comfortable, stocks can trade ahead of the reality and reflect 'normalized' earnings.

Keep in mind, too, that option investments often (if not most of the time) end up worth ZERO.  So that should be kept in mind in any option investment idea.

I would certainly call this idea 'speculative' as it does involve an option, a business with a lot of unknown risks and a management that I don't necessarily have the confidence in as much as Buffett seems to (and as much as I have for other, proven well-managed financials).

But I *do* like it as a levered play on a normalization in the markets.  There is a good chance that there is still way too much pessimism and fear with respect to financial stocks in general and especially at troubled institutions like BAC.

Merrill Lynch
There has been a lot of talk over the past couple of years about spinning off Merrill Lynch; that Merrill Lynch has a lot of value and the market would give it a higher value if it was spun off.

I will take a look at that in a possible future post, but right off the top of my head, one big problem with that thesis is that other independent investment banks too are trading cheaply.

Goldman Sachs is trading under book value and just over tangible book value per share, and Morgan Stanley is actually trading at 0.6x book value.

So I wonder how much value would be added to BAC as a whole from a Merrill Lynch spinoff.

In any case, I will take a look at it and may make another post.


Thursday, March 22, 2012

On Gold and Inflation

I typed this up in late February and just found it as a 'draft' in my blogger.   I thought I posted it already but didn't.  So here it is:

So Buffett has a nice tutorial on investing in the most recent letter to shareholders (2011), available for free at the Berkshire Hathaway website.

He says that gold is just an object and doesn't produce income; that he'd rather own farmland, several Exxon Mobiles and $1 trillion of spare cash rather than own all the gold in the world.

Of course, this has gotten some of the predictable responses.  I've even read some investment managers respond emotionally and angrily to Buffett's views on gold.  That he just doesn't get it, that he is so smart but just has no clue about gold etc...

Well, first of all, when people respond with anger and emotion, it's usually not a good sign.  Most people wouldn't care what others think of their investment ideas.  That is the most important part of succussful investing; being able to think independently.  Not seeking others who agree and dissing people who disagree etc...  As Benjamin Graham says, you are right not because people agree with you, but because your facts and analysis is correct.

So when people respond emotionally and with anger when Buffett calls their favorite investment idea just a 'thing' and not a good investment, this tells me more about gold and the people who favor it.

This is not too dissimilar to what happened in the late 1990s too.  People said Buffett just doesn't get it.  I heard the same thing.  People were even telling *me* that I should know better since I work in finance and deal with stocks that this internet thing is for real.  I too faced anger and ridicule when I said most of these internet stocks will go to zero or at least down 90% or some such. 

People really got mad when I said that. I do remember that well.  I knew then that I was going to be right.

People who are confident and right don't care if others disagree with them.  In fact, most of my best investments were the ones people would look at me incredulously.  One of them went up 20-fold; someone called it just junk.  Another one was a 10-bagger and my broker came back to me with the buy ticket and asked me, "Are you sure you want to buy this?  Did you read the newspaper this morning?  I don't thnk it's a good idea".

Making the right trade is always going to be hard.  People are always going to disagree with you.  If you are upset that the whole world agrees with you but one or two prominent people say it's a bad idea and that bothers you enough to write about it, that's a big problem to say the least!

Anyway, I already talked about gold and how I think at these levels and this level of sentiment and the inevitability in the bulls' eyes that it must go higher (in every conceivable scenario) it's not such a great idea.

But let's get back to the simple question.  What about inflation?  Yes, the Fed is going to keep printing as will other central banks around the world.  Doesn't this make gold a must?

Well, let's think back for a second.

I found this great data at the Coca-Cola website and thought I'd use it as an example of what I always talk about.

Let's say that back in 1919 you were worried about inflation.  In fact, the Fed was just created in the world looked like it was going to print a lot of money every time something bad happened.  The world looked just as unstable then as it does now.  In fact, it looked worse.  You were looking at another world war in the not too distant future. 

If you had predicted in 1919 what was going to happen over the next 90 years, you would have wanted to own gold.  Almost certainly.  Even I would agree.

What was on the agenda for the next 90 years?

Well, we had World War II.  The boom/bubble bust and great depression. We had the cold war.  We had FDR and socialism.  We had the U.S. going off the gold standard.  We had high inflation in the 1970s.

It was certain that the value of the dollar was going to go down by 90% or more. 

Of course, knowing all of that, most people would opt for gold.

So let's say you bought gold at $20.67/ounce.  Over the next 90 years, you would've been happy to see your gold get up to over $1,700.    All your predictions came true and you made a nice return on gold.

How about another person that had the same view, but decided to buy a stock? 

This person in 1919 would have seen that despite the problems, the U.S. has a great system that will work well over time, and if you own a piece of a good business, you should do well.

So this person buys a single share of Coca Cola at $40/share. 

If this person reinvested dividends for the next 92 years until the end of 2011, what do you think the value of this stock would be?

$9,270,325

Yes, that's not a typo.  A $40 investment in a single share of Coca Cola stock turned into $9 million!  Compare that to an investment in gold. A $20.67 investment turns into a whopping $1,700.

OK, OK, you say.  But who'da thunk Coke woulda been such a hit?  You coulda invested in a company that went bust.

Fair enough.  But we know that if you just owned the stock index, you also would have returned 10% or so per year.  (I didn't check specific end points, but I think it's safe to say that stocks returned 10%/year in the 20th century).  So a $20.67 investment in stocks would be worth $132,882 in 92 years.  Not quite $9 million, but way better than $1,700 (that gold would be worth).

So what's the point?  The point is that yes, gold will hold it's value over time on an inflation basis, but it's still just an object.

When you own a piece of a business, and it's a good one with good products, they should have pricing power.  When you have pricing power, you just raise prices as the value of the dollar goes down.  If it's a good business, you can grow it too over time so the value of the business grows.

So there are many levers to increase the value of the business.

Gold just sits there.  A business is a group of people working hard, full time every single day trying to increase the value of the business, and they can change and adjust as circumstances change.  Gold can't do that.

This is why businesses increase in value over time more than commodities, and this is what the inflationist gold bugs totally miss and why Buffett says what he says about gold (versus producing assets).


Wednesday, March 21, 2012

Financials Still Cheap

The financials have really exploded this year as unemployment and other economic figures continue to show some decent recovery.  Europe doesn't seem like it's going to blow up tommorow.   China seems to be going into a hard landing but China might be a laggard to what has happened in the U.S. and Europe in the recent past.  Ironically, China may recover if the U.S. continues it's recovery.

Anyway, I have liked the financials recently and they have done well, but some of these stocks are still pretty cheap.

Some of the well managed insurance companies like White Mountain (WTM), Markel (MKL) and Alleghany (Y) continue to trade not too far from book value and Berkshire Hathaway (BRK) too seems to be trading at around 1.1x book value.  Buffett indicated pretty strongly that he thinks BRK is worth far more than book value and actually took the time to tell us that each segment is worth far more than book value in his Letter to Shareholders.

Here's a quick look at two of my favorites.  (I also bought some Bank of America (BAC) LEAPs recently before the pop after the stress tests; I may post about that later but I thought this was a Greenblatt (Stock Market Genius book)-like trade)

Goldman Sachs (GS)
GS has come back strongly since last fall and is up to $126/share or so despite the very public and 'humiliating' resignation of a junior employee (I think it was more embarassing to the resigning employee than to GS; I immediately saw that as a sour grapes story).

But even after rallying so much, GS stock still trades at slighty above tangible book value.  Again, I tend to think that's incredibly cheap, barring of course another financial crisis.

GS didn't do quite so well in 2011 as they decreased their risk to wait for opportunities.  Some say that they have shrunk their book due to regulatory uncertainty, but during conference calls they always said that it was solely a function of opportunity.  They don't take a lot of risk when they don't see the opportunity.  

Anyway, let's see how they did over the past decade or so in terms of return on average equity (ROAE) and return on average tangible equity (ROATE).

I don't know why this table is upside down; I typically input numbers going down, but oh well...   It's not worth fixing.  I just pulled these quickly from their annual reports; they used to report only ROAE, and then both and now they only put ROAE.  I think that's because book value has grown to make goodwill a much smaller portion of book value so over time ROAE and ROATE will converge.


The average ROE from 2001-2011 is 17.2%, and for the last five years it's been 15.1%.

From this you can see that GS has done incredibly well since 2000 in terms of returns.  It is pretty amazing, actually. 

Think about what happened since 2000.   We had the internet bubble collapse and the stock market went down 50% (NASDAQ went down 80%) and they earned double-digit returns throughout.  This period also included 9/11 and the Iraq and Afghan wars.

Right up until 2007, they earned very high returns and then the crisis came.  This was the worst financial crisis in history that took many banks and brokers down and GS came through it without losing money in any single year.

With this 'horrible' decade where the stock market went nowhere (which is misleading as it actually had TWO bear markets where the market went down 50%), GS had only two years where ROE was below 10% and didn't lose any money.

Since 2001, GS has only had two single digit ROE years and never lost money despite two big bear markets.

BPS for some key years were:

                    2006     2007       2011
BPS           $72.62    $90.43   $130.31
TBPS         $61.47    $78.88   $119.72


Since the peak in 2007, GS grew BPS by +9.6%/year and tangible BPS by +11%/year.
For five years, the respective growth rates were +12.4%/year and +14.3%/year.
For the past decade, 2001-2011, BPS grew +13.6%/year.

That's pretty amazing.

I know, I know.  Investment banking is dead and they will never make good returns ever again.  The Volcker rule and many others will limit what they can do.  

But we've seen all of this before.  Dimon has said that this talk that banking is dead is ridiculous and that the industry is *always* changing; he's seen it before many, many times before over the decades.  Every time, people think it's all over.  But banks adapt and find new ways to make money.  This time is no different.

I also remember reading about Mayday and the Big Bang when stock brokerage commissions were deregulated.  That too was supposed to be the end of the investment bank as their 'fixed' commissions made them so much money in the past.   Oops.

GS will be much more adaptable than many other financial institutions since they don't have the bank branch infrastructure, long dated assets like insurance companies; they can move capital to where they can earn an acceptable return.   If there is no return, they will return capital to shareholders etc...


JP Morgan  (JPM)
So JPM has also rallied a bit to around $45/share.  Is it still cheap?  Dimon has said they can earn $24 billion in a more normal environment, so with 3.77 billion shares outstanding, that's an EPS of $6.36/share or so.  At $45/share, JPM is still trading at 7x 'normalized' earnings.   That's pretty cheap for a bank of JPM's quality.  At 10x p/e, JPM would be trading at $64/share or so and at 12x, $76/share.

As I started to type this up, I had forgotten that I already made a JPM post about their investor day (look here).

But anyway, it's just a simple update so I'll keep going...

Like GS, JPM has done really well throughout the crisis even though JPM was supposed to be the first domino to fall (due to derivatives, leverage, investment bank attached etc...).

But again, here is JPM's return on equity (ROE) and return on tangible common equity (ROTCE) for the years 2005 through 2011:

            ROE       ROTCE
2005       8%       14%
2006     12%       22%
2007     13%       21%
2008       4%         6%
2009       7%        11%
2010      10%       15%
2011      11%       15%

Return on equity by segment:

                                                   2010        2011
Investment bank                         17%          17%
Retail Financial Services              7%            7%
Card Services and Auto              16%          28%
Commercial Banking                  26%          30%
Treasury and Security Services   17%          17%
Asset Management                      26%          25%

The return on equity by segment shows that most segments are doing pretty well except Retail Financial Services, which should recover as the economy recovers and if housing stablizes and employment continues to go up.

So despite all the naysaying about financials, I continue to believe they are cheap and will do well over the next few years.

Quick Comment on the Market

So the market has come up quite a bit since last fall when I made a bunch of posts showing that the market was reasonably valued and there was too much pessimism.  I think the market still looks and feels fine.

There are people who say it's getting bubbly and bullish consensus is too high, but I don't sense that too much at all.  People still seem to be in denial about stocks.

I agree that we aren't out of the woods, but I think the market rally so far has just discounted the lower likelihood of a bad blowup in Europe.  Sure, Greece is certainly not fixed.  But as I have been saying here, a complete blowup/meltdown is off the table for now.  Last fall, the market feared a complete Euro-implosion.    The likelihood that we will just muddle our way through this has increased substantially and that's what the market is reflecting; the market is not reflecting all problems solved/nirvana.

As proof of that, the financials even with the substantial rally is still pretty cheap.  Maybe I'll post a quick update later, but Goldman Sachs (GS), for example, is still trading at around tangible book value which is incredibly cheap barring another financial crisis. Despite the headlines, GS is still the best managed investment bank out there and is pretty nimble when it comes to changing market environments. 

Unsustainably High Profit Margins?
Anyway, one argument I keep hearing is that even if P/E ratios are reasonable-looking at this point, profit margins are at all time highs and are unsustainable.  So if margins go back to what they usually are, the argument goes, then P/E ratios aren't as cheap as it looks.

I posted about this before, but here's a quick update.  First, here's what people are talking about:


So just by eye-balling it, it looks like profit margins average around 6% over time, and now it's way up over 10%.  Sure, this looks unsustainable!  This may mean profits are overstated by 60%.  If profit margins revert back to more normal levels, profits can plunge 40%.   That means, with a constant P/E ratio, stock prices can go down 40% too.

But here's the thing.  I spend most of my time reading annual reports and SEC filings, and I haven't come across anything close to this sort of abnormally high profit margin.

I posted a table before and I updated it with 2011 full year figures.  I just picked a bunch of large cap names off the top of my head so I didn't cherry-pick names to make my point.

Here is something closer to what I see:

Operating Margins of Some Big Blue Chips


If you look through the table at the operating margins of these 'typical' companies, I don't see any abnormally high profit margins at all.  I did expect Exxon Mobile (XOM) to have some excessive margins with crude oil up here at over $100 and gasoline prices on the rise.  But even at XOM, margins have been lower in the past three years than in 2001 and much of the early 2000s.

So where is the excessive profit margins?

My favorite investment ideas lately as I've been posting here since the fall are financials.  I didn't include any financials in the above table as we don't have to look to know that profit margins at financials have been pretty low since the financial crisis.  Banks, investment banks and insurance companies are not making anywhere close to the profits they did before 2008.  So there is no abnormally high margins there either so go figure.


Graham and Dodd P/E Too High!?
The other argument I hear a lot these days is that although the regular P/E ratio is reasonable at around 15x last year's earnings, the Graham and Dodd P/E ratio is way too high at 24x or some such high number.

So what is the Graham and Dodd P/E ratio?  This is simply a P/E ratio calculated by using the average earnings over the past ten years instead of just the most recent year.  This adjusts for the 'cyclicality' in earnings.  Earnings of companies tend to be cyclical; high in good times, low in bad times.  So by taking a ten year average of the earnings, this supposedly smooths out these cyclical ups and downs and makes valuing the market a little easier and more 'accurate'.


Above is the chart that shows that although the trailing P/E shows a reasonably priced market, the red line shows that we are still way overvalued.  One reason I've been skeptical of this figure is because I think that the large losses from the financial crisis is included in the ten year average earnings so tends to make the earnings look really low.  Is this abnormally low?  I tend to think so even though others will argue that those losses were 'real' and not necessarily one-off events as financial crises tend to happen with regularity (I would counterargue that the 2008 crisis was not a typical once-in-a-decade event, but much bigger, less frequent event).

Otherwise, I would think the message it sends would be reasonable.

But again, we have to look at what this means for investing.  I scratched my head when I saw this chart so decided to create a table of my own using the blue chip stocks in the operating margins table above and see what the historical P/E, 2012 estimated P/E and Graham and Dodd 10 year average earnings P/E ratios look like.

It's always good to look under the hood to see what the big, macro charts actually means.

Here is my table:


So what people usually look at are the historical P/E ratio (most recent fiscal year or trailing twelve months or some such) and the expected P/E ratio for the current and next year. 

In this table, I do see that many of these companies do have a pretty high Graham and Dodd P/E ratio.  Coca-Cola (KO) has a Graham and Dodd P/E of 27x and IBM's is 28x.  Disney's is 27x and MCD's is 34x.

So those are pretty high figures.  But wait a second.  Of course they are going to be high since these companies have grown their earnings in the past decade.  The higher growth in EPS in the recent past, the higher the 10-year average EPS P/E is going to be.

Is that a bad thing?  Should we look at MCD, KO, IBM and DIS and think they are too expensive because of their high Graham and Dodd P/E's?

I'm not too sure about that.

Let's look at the Graham and Dodd P/E versus their prospective EPS P/E (for the current fiscal year):

                          Graham and Dodd P/E          2012 estimate P/E      10 year EPS growth
KO                     27.31x                                  17.36x                          +12.7%/year
IBM                   28.05x                                  13.72x                          +21.9%/year
MCD                  34.35x                                 16.94x                          +23.4%/year
DIS                     27.04x                                 14.61x                          +17.1%/year

So even though the Graham and Dodd P/E ratios look ridiculous, the prospective P/E ratios look very reasonable.

I don't really know the dynamics of how this works for the whole market.  It may have something to do with the big losses in financials during the crisis and their current 'high' valuations due to depressed earnings that make the 10 year average EPS P/E ratio look high.

The other argument would be to doubt the prospective earnings for 2012.  Again, they will point to the unsustainably high profit margin chart shown above.  But if you look at these 'typical' blue chips, they don't have unsustainably high margins (see margin table).

So although I would be cautious if the overall market was getting expensive, again, I don't really see it when you really get on the ground and look around; the top down macro story (unsustainably high profit margins combined with way too high Graham and Dodd P/E ratios) that looks compelling doesn't really match the reality of individual companies.

Quick Comment on Apple
So what's up with Apple?   Apple looks insane for sure; it does look like it has come too far too fast and is talked about so much that it has to be a candidate as a bubble stock.   BUT, the most important factor is missing from the "Apple is a bubble" story; valuations.  Apple stock is still astoundingly cheap on a valuation basis. 

Is the earnings unsustainable?  I can't say where it will be in five or ten years, but at the moment, they seem to have incredible momentum.  They do seem to have a high market share of the tablet market, but if you look at tablets, laptops and computers together, then they are barely scratching the surface.  The iPhone too, doesn't seem to have unsustainable market share either.  

So the runway still looks pretty long.    I would be a worried long, but definitely not short this thing.  I think at some point before the Apple boom starts to tire, the stock price will get up to a more 'reasonable' valuation.  That's my guess.


Conclusion
There is certainly a lot to worry about.  Sovereign debt levels look very high around the world so we haven't solved all of our problems.  But as wise investors always say, it's not usually a good idea to wait around for all the problems to be solved because then the markets would reflect that and would probably be pretty expensive.

The most important takeaway from the above discussion is that oftentimes we will get scary looking charts that scare people away from stocks.  It is a good idea to keep an eye on these things.   But I think it's not prudent to just sell stocks just because of some scary looking charts.

Back in 2000, the charts were quite scary too and it sure wasn't a bad idea to get out of stocks.  On the other hand, you might have done even better if you looked under the hood and just stayed out of the expensive things (tech stocks, internet stocks, Coke at 40x p/e etc...) and invested in things that weren't expensive (most notably Berkshire Hathaway at the time and many of the old 'industrials' that didn't have a .com at the end of it's name).

There are quite a few people who made great track records in long only portfolios even starting in 1999/2000.

It is very important to know and understand what the charts and other information you get mean before acting on them. 

It would be a huge mistake to see the above charts and sell stocks and buy bonds or whatever, as I still see great values in the stock market (I will post a short, quick update on Goldman Sachs later).  If high valuations are a concern, sell stocks that are trading at high valuations.  If high and unsustainable profit margins are a concern, find the companies in your portfolios that might have unsustainably high profit margins and sell those.  Don't sell stocks that don't have this problem!


Friday, March 2, 2012

Markel 2011 Annual Report

Markel's annual report was released and it's a pretty good read.  For fans of Berkshire Hathaway, this is a company that is following a similar model; insurance company with emphasis on underwriting profits instead of premium growth, investing float unconventionally (more equities than most insurance companies) and is even starting to invest in operating businesses through their Markel Ventures segment.

Anyway, MKL is interesting to look at as it is trading at 1.16x book value (BPS at December 2011 of $352.10/share versus current price of $410.64) which is pretty cheap for a solid company like MKL.

However, as I will mention later, MKL's valuation may not go up much if interest rates don't 'normalize' or if the insurance market doesn't 'harden' and they can't get their float / investment leverage up. 

Anyway, a quick summary is:
  • Combined ratio of 102% due to the high number of large catastrophes like the Australia/Thailand floods, earthquake in New Zealand and Japan, tornadeos and hurricane in the U.S. etc...  These catastrophes accounted for 8 points of the combined ratio.  At $105 billion in catastrophe losses for the industry, this was the largest catastrophe loss ever.
  • Total tax equivalent investment return was 7%.  Before tax adjustment, the investment portfolio returned 6.5%; the fixed income earned 7.6% (largely due to decreasing interest rates and rising bond prices) and the equity portfolio gained +3.8%.
  • Book value per share was $352.10/share, and increase of 8% for the year. Book value increased 9%/year over the past five years.  Book value grew 12.3%/year in the past 10 years and +17%/year in the past 20 years.  The one and five year growth rates are pretty impressive given the huge catastrophes last year, financial crisis and very soft insurance market in recent years.
  • MKL says that their equity portfolio is earning double digit returns on an underlying basis, implying that eventually the equity portfolio too will start returning double digits.  

Anyway, here are some pictures from the annual report:


It is impressive that they grew book value 8.9%/year over the past five years despite the financial crisis and the many catastrophes (especially last year).  Book value per share grew last year.

The book value per share growth rates for various time periods, again, is:

5 years:   +8.9%/year
10 years: +12.3%/year
20 years: +16.9%/year


Underwriting performance also continues to do well compared to peers...


Investment results aren't too exciting, but again t he market has been flat recently with a big crash in between.


Anyway, what is the steady state, normalized increase in book value per share we can expect with MKL going forward?  Historical book value growth is very impressive, but with lower investment leverage and much lower interest rates, it's going to be tough to grow book value.

Of course, if the economy really starts to recover, the insurance market hardens (it doesn't stay soft forever) and interest rates start to come up, then MKL can really start growing at a nice pace again.

But let's not bake that into the cake and see what happens if things stay more or less the same.  I will assume a combined ratio of 97% (the five year average is 96%, ten year average is 97%-ish), bond yields of 2.0% and various return levels for the equity portfolio.

And I will use the current investment portfolio allocation mix and unchanged earned premiums. 

So other than underwriting profits and investment returns, there is income from the Markel Ventures operating business portfolio.  As a proxy I will use the other operating income (Other revenues minus other expenses; Markel  Ventures is in here, although I think interest expense is below the operating income line on the income statement so will not match what MKL says is their earnings from this business)

Deducted from that would be interest expense and amortization of intangibles.

Given all of the above, if bonds yielded 6% and stocks returned 10%, the steady state, normalized increase in book value of MKL would be 15.1% pretax and 9.8% after tax.  That's not bad at all, but not that exciting.  This is due to the lower investment leverage lately.

Bonds don't yield 6% anymore, so let's see what happens if the bond portfolio actually only yielded 2%.     With a 2% bond return and 10% equity portfolio return, the pretax ROE would be 8.6% and 5.6% after tax.

With 2% bond return and stocks only returning 7%, the same would be 6.9% pretax ROE and 4.5% after tax ROE.

So this is clearly not that exciting is current conditions persist.

This would be a no-brainer buy if MKL can earn 10% on book even in these conditions, but that's not really the case.

However, we do have to give credit to MKL for the fact that they *have* increased book value at a nice clip in the past five and ten years despite horrible conditions.

So what can I say?  I do like MKL; they seem to be a solid shop run by decent, honest people.  Their historical track record is impressive.  The stock price is very reasonable and in more normal times this can easily trade far above book value.

However my only reservation is that if soft market conditions persist and low interest rates persist for longer than people expect (as in Japan), then MKL's growth in book can slow down a lot over the next few years.

We'll see.