Wednesday, February 29, 2012

JPM Investor Day

So J.P. Morgan had their investor day yesterday and Dimon was pretty optimistic about J.P. Morgan and even the economy (I wasn't there).  He does see a lot of businesses so has a good feel for what's actually going on in the economy than economists that just sit around inputting data they get from the Labor department into spreadsheets.  He says that the economic recovery is pretty broadbased and many if not all areas of his businesses are growing loans, maybe with the exception of housing.

Anyway, here are some slides I took from the presentations from their website.

I already mentioned what a great investment opportunity JPM was last fall when it was trading at tangible book value.  You can read that here:  JPM at Tangible book


Book Value per Share Growth
As I said before, what is truly amazing about Dimon and J.P. Morgan is how they performed during the worst financial crisis in history.  Remember, J.P. Morgan was often cited as the first domino to fall in any financial crisis due to their huge derivatives book and exposure to the investment banking business.

But look at the chart/tables on this slide:


From 2006 - 2011, that includes the peak of the bubble and then the collapse in 2008-2009 and recovery which hasn't been completed yet.  JPM grew their book value per share at 7%/year during this time, and 9%/year for the past ten years.  Again, that *includes* the financial crisis!   Tangible book value per share grew 12%/year over this time period and 8%/year over the past ten years.

I know many bank critics will say that they just got bailed out so of course they did well.  As I said before, I don't think JPM needed the TARP money.  They took it, paid high interest, and then paid it back.

Did JPM need the financial industry to be bailed out to survive?  Well, if the whole system collapsed, then yes JPM might have gone down too.  But that's what the Fed is there to prevent and that's what they did.  I don't think there is anything wrong with that.

Other critics will say that JPM is or was insolvent but of course they didn't lose money because they didn't have to mark their books correctly.  Again, I would just say that Dimon is the best and most conservative manager out there and he *hates* mismarked books more than anyone.

And if it was just a simple accounting trick that prevented JPM from going under, then how come Bear Sterns, Washington Mutual, IndyMac, Citigroup, AIG and many others didn't use the same accounting trick to prevent taking losses? 

So no, it wasn't an accounting thing or mismarking that allowed JPM to perform well.  It was just managed well. 

Low Return on Assets?
I think one reason why JPM trades for cheaper than, say, Wells Fargo, is that their return on assets look much lower. 

In the slide below, JPM shows that their return on assets is low due to their large exposure in the investment banking business, which is not a loan spread business; much of their assets will show a low return on asset.


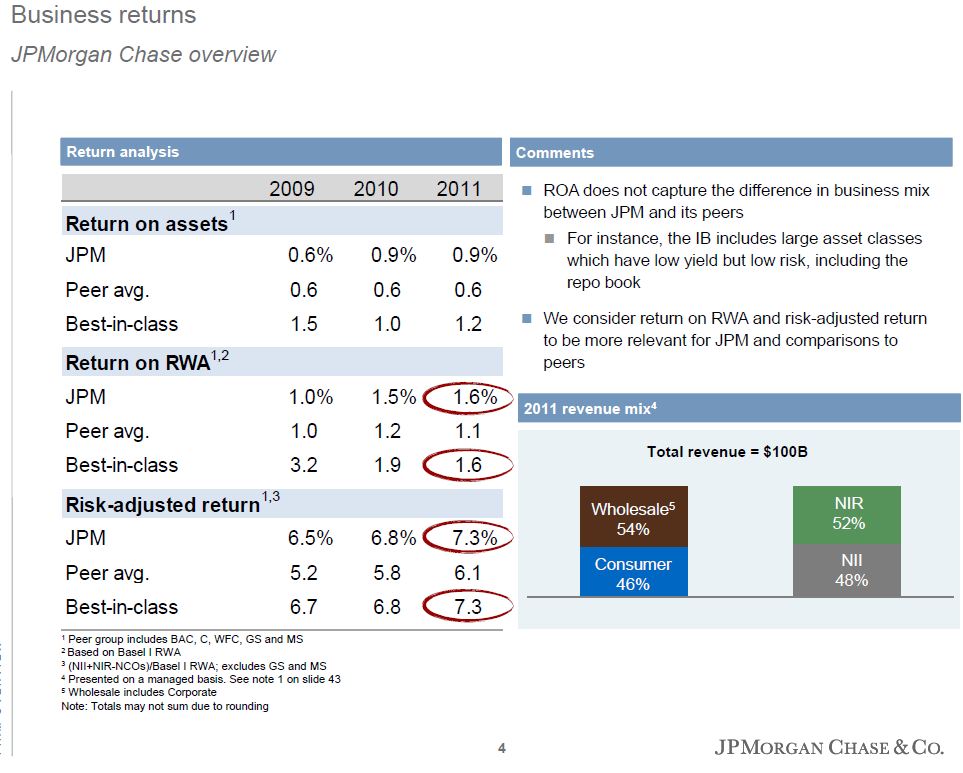
Adjusted for these differences, JPM looks much better.

ROE by Business Line
Also, ROE of each of the business lines look really great, and that's amazing when you think about the fact that even the great Goldman Sachs didn't do too well on this metric in 2011.


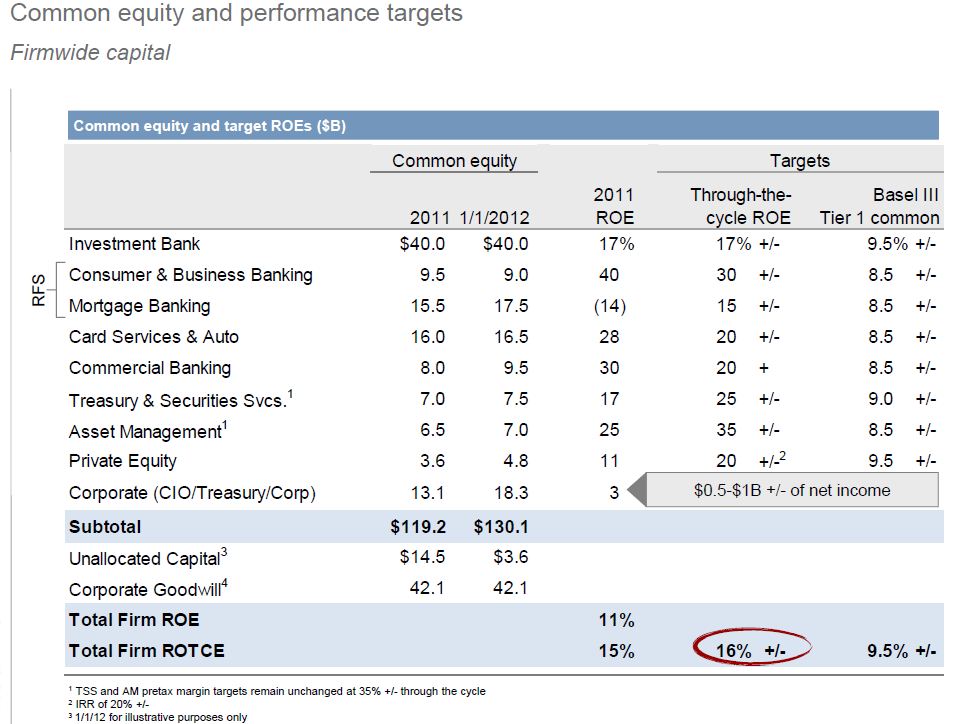
The investment bank earned an ROE of 17%.  Consumer and Business Banking earned an ROE of 40%.  It's truly amazing how profitable these businesses are in a time when financials aren't doing too well in general; loan growth is low or non-existent, housing hasn't recovered, the economy is still very slow to improve etc...

JPM continues to invest for growth, so there could be some tremendous operating leverage when more areas of the economy start to pick up, like housing.  They have really built up their mortgage business so if housing starts to come back, upside could be substantial in this area for JPM.


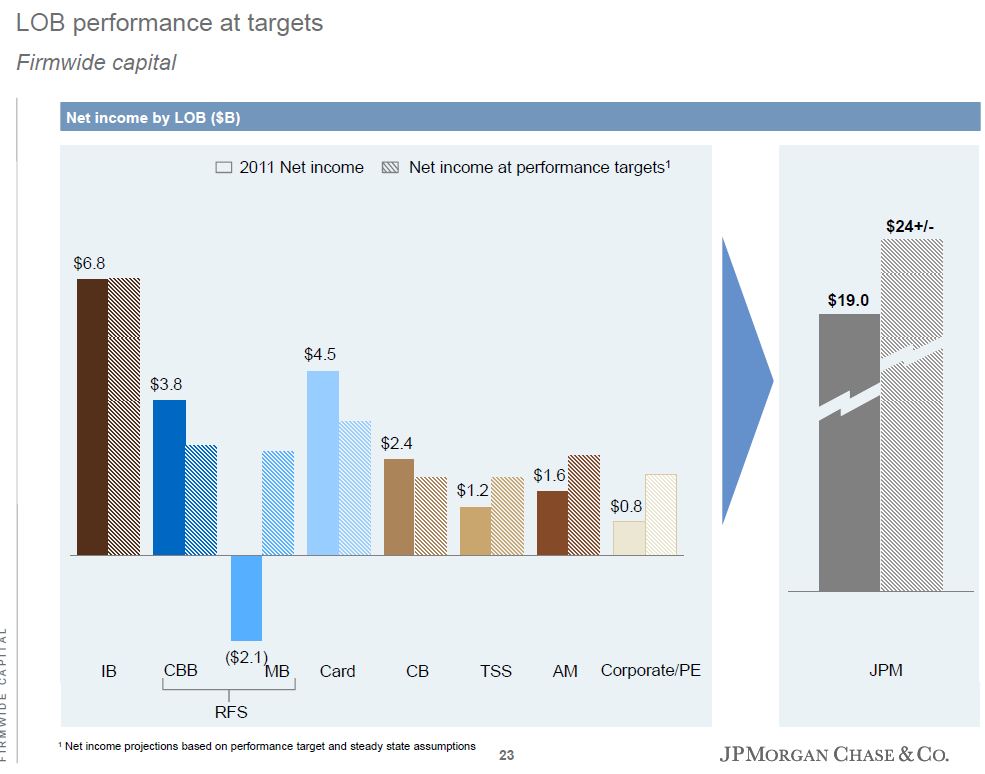
So JPM has performance targets by segment.  Assuming each segment achieves it's ROE target, the total net income to JPM would be $24 billion.  With 3.8 billion shares outstanding, that comes to $6.40/share in EPS

Now hold that $6.40/share thought for a later section.


The following bridge, or walk or whatever you want to call it is how JPM can get to $24 billion net income.  It includes the normalization of high credit charge offs, mortgage related expenses and things like that but doesn't include any robust recovery in the economy or any such thing.  Growth inititiaves only add 4% or so. 


Capital and Stress Test


It doesn't look like acquisitions will be a major thing in the near term as Dimon seemed to suggest that it's off the table for now because he doesn't think it's politically doable now in this environment (where people are calling for breaking up the too-big-to-fail banks).

I think over the next few years, people will be surprised at what Dimon is building now.  Many banks are cutting investments to boost profits (like Bank of America?) as Dimon keeps spending to build branches and expand market share.  This may not be evident or visible now as housing is still in the dumps, so expanding mortgage operations won't really show results as much as when housing starts to pick up again.

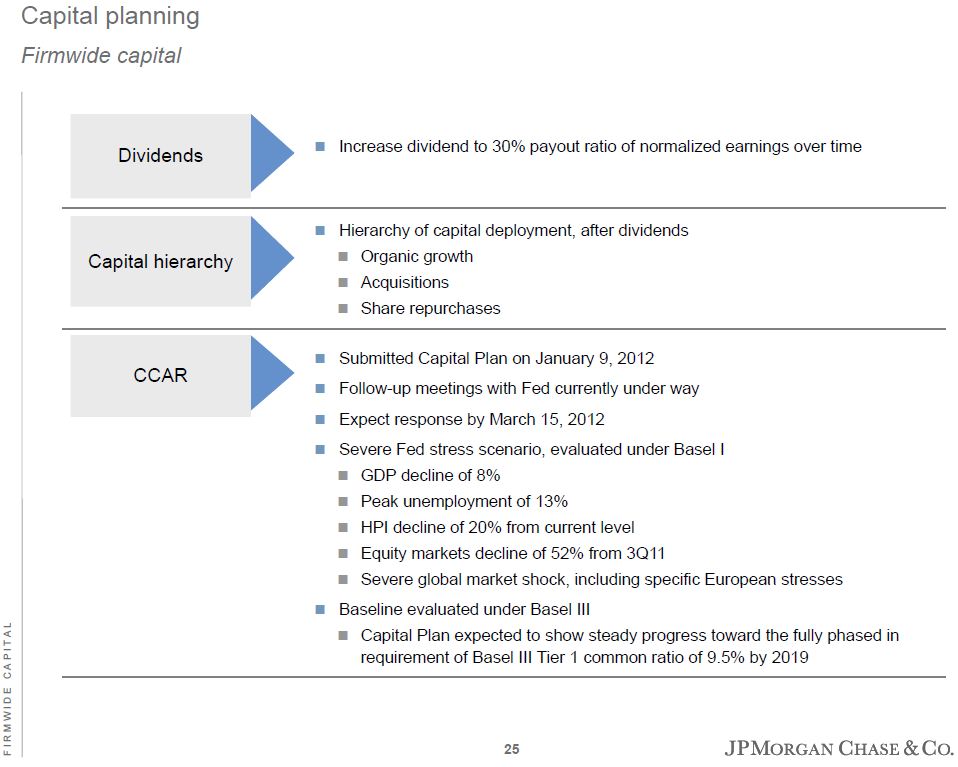
Anyway, the other issue with the banks is the stress test.  It's amazing how well prepared JPM was for the last real crisis and they have always been ready for them.  So this stress test should be easy for JPM.  It is encouraging that even with the above stress test scenario of housing prices going down another 20%, unemployment rate going up to 13%, GDP going down 8% and stock prices going down 50% from their 3Q2011 lows that JPM will have no problem getting through it.


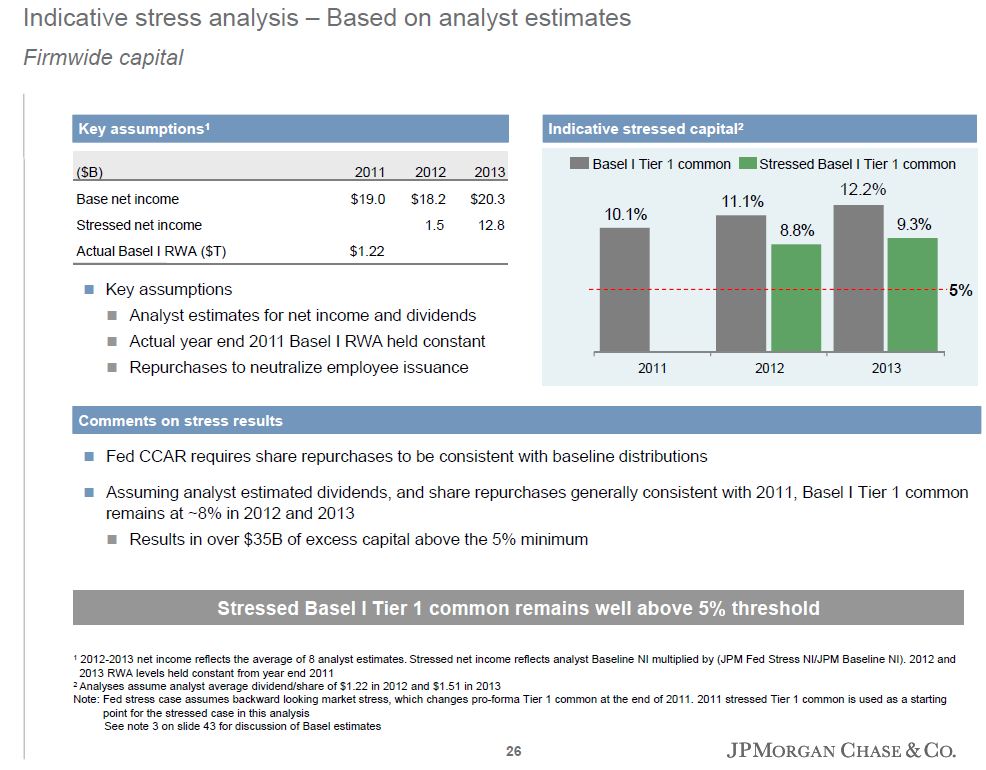
Incredibly, they would get through that crisis with a positive net income.  Now, that's a fortress business!

Conclusions
So what does this all mean? 
  • If you go back to the above $6.40/share EPS based on the lines of businesses achieving their ROE goals, that would put JPM's stock price now 6.3x p/e.  That's pretty darn cheap.  At 10x p/e, JPM could easily be trading at $64/share.   Again, this goal is not a stretch target by any means and the earnings walk shows that this EPS is achievable without any major economic recovery or anything like that.  If JPM traded at 15x p/e, the stock could easily get to $96/share.   I know it seems ludicrous to think that a financial company can trade at a 15x multiple as people are still suffering from a sort of post-crisis syndrome, but I think people may be surprised.  Don't forget, it wasn't long ago that bank stocks traded at 2-3x book.  Markets do change.
  • The first chart above shows how well JPM is managed, growing book value per share through the crisis at a healthy pace.  Dimon thinks they can earn at least 15% on tangible equity and I did say last fall that tangible book value per share is a no-brainer buying opportunity because of that 15% floor in returns (that they actually achieved even in bad times).  Their ROE too is above 10%.  The return on equity for the last five quarters were:  11%, 13%, 12%, 9%, 8% and the return on tangible common equity was 16%, 18%, 17%, 13%, 11%.  And this was when banks and investment banks aren't supposed to be doing too well.
  • So from the above, we can say that tangible book value per share is a really cheap level for JPM shares and one can easily argue that it is worth at least book value per share, which is $46.59/share from the above chart.   It's now trading at under $40/share,  so is trading at a 14% discount to that.
  • Wells Fargo too has low double digit returns on equity (9.9%, 10.3%, 12% for the years 2009, 2010 and 2011) and trades at 1.3x book value per share.  If JPM traded at a simliar 1.3x book value per share which I don't think is unreasonable or aggressive at all, that would put JPM stock at $61/share.   That's 50% higher than where it is trading now.
  • I think the market doesn't like banks now for obvious reasons, and they also really dislike investment banks as they think the model is dead.  But JPM has proven and is proving that they can make money and good returns in the business.  Over time, I think people will get over this fear and the market will increase the valuation of JPM closer to Wells Fargo.
  • So either way you look at it, at 10x the $6.40 normalized EPS or 1.3x book value, you can get to JPM trading at $60+/share without being too aggressive.
  • The caveat, of course, is that this is a financial stock so a total blowup in Europe or a deeper recession in the U.S. would cause all financials to sell off.  A prolonged low interest rate environment as in Japan can keep up downside pressure on net interest margins too, so this is not without risk. 
  • As usual, if you are interested in JPM, check out the slides at the JPM investor relations website and do your own work!

Wednesday, February 15, 2012

I Am Out

I don't mean to make this a trading journal or stock buy/sell recommendation site, but I thought I'd mention that I am a bit less enthusiastic about AAPL now as the world seems to be quickly agreeing with the bullish views.
I never intended AAPL for me to be a long term investment as it is in the quick changing world of technology; today's AAPL is tommorow's Sony or Motorola. 

But I owned AAPL for the simple reason that it was so darn cheap for a company doing so well.

Now I think it is less so.  I think AAPL is still easily worth more than $600 (15x trailing eps plus cash and investments per share; see my earlier posts on AAPL).

I think now, though, the market is catching up and the stock is up a lot on rumors of a dividend, new products and things like that.

Even at the outset, I never would have considered owning AAPL at a 'normal' valuation, of say 15-20x p/e.  I only bought it because it was below 10x p/e.

If this was intended to be a long term hold for me, I would not sell just because the stock price moves up a bit.

But since this is not the case, I have no problem selling out now.

The problem with technology is how quickly things change.  Apple has had a good run from the iPod to iPhone to the iPad.  It's an incredible run.  I have no reason to believe they won't have another superhit, but I tend not to like owning companies that depend on them, unless they are supercheap.  (The iPad may still be in the early stages too).

I believe that in three to five years and certainly in ten, these products will all look more or less the same.  Of course, at that point in time AAPL may have another game-changing product.  But again, I wouldn't want to depend on that in my stock holdings.

The Apple stores are great and they do very well but that's largely due to Apple's success in launching amazing products.  What happens when this run ends?  What will they sell at these high rent stores?

These are things I have no real visibility on.

For Apple fans, though, the stock is certainly not expensive so holdings shares should be fine.

For me, though, I am out  (around $523.50).  

Friday, February 10, 2012

Cracker Barrel / Biglari Holdings

To continue the story, Biglari Holdings (BH) bought 1.05 million more Cracker Barrel (CBRL) shares in January for $54 million.

So that sort of changes the composition of the balance sheet.  At the end of December 2011, BH had cash and investments of:

Cash:             $115 million
Investments:  $119 million

So the above transactions changes that to:
Cash:              $61 million
Investments:  $173 million

So that's a pretty big position now in CBRL.  In my last post, I thought BH is worth around $580 million as is, but may be worth $840 million as margins at the restaurant (SNS) improves.   So either way you look at it, CBRL is a pretty big position for BH.   (I ignore small changes in the stock price of CBRL for now).

Partly because of that, I spent some time at the SEC website reading through the filings at both companies; CBRL and BH.  The back and forth during the proxy contest last year is very interesting with both sides making interesting points and both sides having good presentations.

Whatever you think of either side, it's really interesting and educational to see what each side has to say.  All of this stuff is available at the SEC website for corporate filings, and the respective corporate investor relations websites.   Biglari set up a website specifically for his CBRL proxy contest and it makes for very good reading. 

It is accessible at the following website:

http://www.enhancecrackerbarrel.com/

You can read all of Biglari's points in his letter to CBRL shareholders.  It is well written and easy to understand.  Again, I don't worry too much about who is right or wrong.  One learns from listening to both sides.

Unprofitable Capex
Anyway, one interesting point Biglari makes is that CBRL has spent a lot of money building new stores that increased revenues but hasn't really been profitable:


This is a very good point.  This is similar to Ed Lampert's point about capex in the retail industry and really cut down on capex.  In that case, so far, it doesn't look like it's working too well.  But let's not let one or two situations influence our decision.  I too tend to believe that corporations tend to spend money by 'inertia'.    There are a lot of motives that drive companies to spend or to grow at the expense of profitability.  (Some older blue chip firms obsessed with market share is a typical example).


Bad Traffic
CBRL has had some pretty horrible traffic trends in the past few years.  Below is a table from Biglari's letter:


I don't think you can blame the economy for this as the economy was in a boom during 2005 - 2007. I too wonder about expanding stores when trends aren't favorable.  Many retailers will keep opening stores even if it cannibalized their existing base if they think they can get more profit dollars from the market.  But in CBRL's case, as is shown in the above table, this expansion in the face of declining traffic trends has not led to increased profits.


Store Profitability
We already know from the above that profits per store is down; sales are up and operating income is flat, so obviously profit per store is down.


Biglari makes the case that this downtrend began when Evins retired and the current CEO Woodhouse took over.

I think the basic story of CBRL, as Biglari states in the above cut-and-paste text from his letter, is that if CBRL can stop building new stores for the sake of building new stores and focus on store profitability, it can really increase shareholder value.  Biglari says that if they can get per store profit back to the old levels, that would double the value of CBRL.

Incentive plan
So why is CBRL so bent on building new stores and expanding?  They have mentioned over the years that they target 1000 stores nationally.  Maybe this is what it's about.  They did have a goal of growing their store base by 5%/year but at some point they decided to slow that down.  I think they are going to start picking up again (plan to spend $50 million this year on new stores).

Biglari mentions that the CEO got a bonus for achieving a hurdle of $90 million in operating profits in 2011, but points out that this hurdle is way too low as the company hasn't had operating profits below $90 million in years (see table below).   There isn't any mention of margins or growth.

I also notice in the proxy that the long term incentive is based on "achieving long term revenue growth and profitability over performance period" (as well as stock price performance).
It doesn't say, "achieving long term revenue and profit growth", but revenue growth and profitability, which might explain why CBRL keeps spending money to open stores even when it doesn't contribute to earnings growth; as long as they are profitable, it doesn't matter. They need to grow revenues.

So on the issue of growing stores without growing profits, Biglari has a good point and the reason might have something to do with this long term incentive plan.

Operating Margins
OK, so let's get back to store profitability.  I will actually just look at the overall operating margin of CBRL over the years.  Below is the sales, operating income and operating margin of CBRL since 1994.
So you will notice that operating margins have been trending down starting with a big drop in 1999 (same store sales trend were down back then and they acquired Logan's Roadhouse in February 1999 which probably accounts for some of the margin drop too.  They have since sold Logan's). 

Between 1994 and 1998, CBRL seemed to earn operating margins of 10-14%.  Biglari mentioned above the year 1998.  Operating margin in that year was 12.52%.  If CBRL can earn a 12.52% operating margin, that would be an EPS of:

$2.4 billion sales (in 2011) x 12.52% = $300 million in operating income, less $51 million interest expense (assuming same capital structure) for a pretax profit of $249 million.  With a 27% tax rate that is net income of $182 million.  With 22.9 million shares outstanding, that's an EPS of around $8.00/share.

From the previous analysis, we know that restaurant companies trade at around 16.5x p/e, so applying that we get a CBRL value of $132/share.   That's 150% higher than the current price of around $53/share.

But wait a minute.  How the heck does a company with sub 7% operating margins suddenly improve that to 12.5%?  That might seem quite a stretch.  The restaurant environment too is very different from what it was in the late 90s.  Surely there is much more competition.  Also, consumers are still pressed, unemployment high and food and energy inflation continue to put pressure on margins.  So it would be unrealistic to expect such a huge increase in operating margins over a short period of time.

Let's do the same exercise at 10% operating margins.  If CBRL achieves a 10% margin (which still might be aggressive), then the value of CBRL might rise to: 

$2.4 billion sales x 10% = $240 million operating income, less $51 million interest expense = $189 million pretax income x (1 - 27% tax rate) = $138 million net divided by 22.9 million shares outstanding is $6/share.  $6 per share x 16.5x typical restaurant p/e ratio is still $99/share.  Pretty much a double.   [ If the value of CBRL doubles, then the total value of BH can be up to $700/share (that includes the improvement in SNS too ]

For another sanity check, I jotted down some operating margin levels from some listed restaurant companies to see if 10-12% operating margins are reasonable or possible.

It's difficult to compare since the business models are so different.  I tried to include companies that mostly owned their restaurants versus the franchise model like YUM brands or DIN (the old IHOP) which have drastically different models.

Anyway, just from looking at this, it seems that most restaurants have suffered declining margins over the years.  Of course, higher costs and high unemployment has really been a negative factor in the sector.  But looking at the table, it doesn't seem to me that 8-10% margins is impossible.  Again, we are talking about a big change in direction so margins can change dramatically in that case (as opposed to the same management just making minor tweaks here and there).

Off the top of my head, I remember other recent situations where companies got used to growing for the sake of growing and lost sight of what was important.  They stopped or slowed expansion to refocus their operations and boosted their margins.

The ones that come to mind are McDonald's and Starbucks.  Both of them have grown for many, many years and came to a point where they decided growth wasn't adding value to shareholders, and that focusing on improving operations at their store base was the right thing to do.  Walmart too, by the way, came to that conclusion recently although I don't see margin improvement there yet.

Anyway, here is a table of what happened to operating margins at McDonald's and Starbucks:
So McDonald's got stuck in the early 2000s, and decided to focus more on profitability instead of growth.  Their margins went from the teens to over 30%.  It's important to remember that MCD was facing a crowded market that was overly competitive ($1.00 menus etc...) and many thought that MCD has gone as far as it can go and that there wasn't much they can do.  SBUX too was in a simliar situation.  They had gone as far as they can go and saturated their stores (and markets with stores) with all kinds of products and there wasn't much more they can do to increase profits.  SBUX too, has done well by refocusing, recently hitting operating margins that are far higher than in their best years between 2004 and 2007.

So rethinking strategy and reallocating capital *can* make drastic changes, even at companies where  few people imagined anything can change much.

This is not to suggest that CBRL can make 30% operating margins or anything like that.  MCD and SBUX are both drastically different businesses.

But what I think it's important to remember is that things *can* change and slowing or stopping expansion to improve operations *can* work to boost margins.

Of course, this doesn't mean it's easy.

I just wanted to point out that it can happen and work, even when the rest of the sector continues to suffer (MCD improves while Wendy's, Burger King etc.. continue to not do too well etc...).

Biglari's Track Record
This is a "by the way", but this was included in one of Biglari's letters to CBRL shareholders.

These are his big recent transactions; it seems that he has done well.

Conclusion
I am no expert on the restaurant industry, so I wouldn't be surprised if some restaurant industry veterans looked at CBRL and laughed at the notion that it can improve operations and make more money.

But *if* they can make some changes, especially cutting back on growing while they suffer declining traffic and other things (like MCD and SBUX did), they may be able to boost margins.  If they do, this can certainly lead to a doubling or at least a higher stock price.

If that happened, from the above analysis, BH stock too can be worth as much as $700/share (CBRL doubles in price and SNS gets to 8.5% operating margin for the year, and then valuing that business at 16.5x p/e).

Again, this is if things go well at CBRL (and continues to go well at SNS).  I think there is a reasonable chance that both go well, but many things can obviously go wrong.  BH is not a Berkshire Hathaway or a Coca-Cola.  It is a small, concentrated investment dependent on the actions of a single person.   So many things can go wrong here. 

This is something that I will watch closely with interest.  Biglari continues to buy shares even as he lost the proxy contest, so it will be interesting how this plays out going forward.   I do think the pressure is on, though, at CBRL and sometimes that's all that is needed to make some positive changes (it was encouraging that the shareholders voted down the poison pill, at least).

Stay tuned.


GSVC Update

So I noticed that GSVC is down 20% into the $15 range as they priced the follow-on offering at $15.00/share.   The stock is trading now around $15.80/share, down from $19.50 yesterday.

Why did they price this so low below the closing price?  The registration statement had an assumed price of $18.75 or something like that, so I'm not sure why they priced this so low.  Maybe they feared problems (lawsuits) down the line if they sold stock at more than a 40% premium to net asset value per share (NAV).

Anyway, I don't intend to update things for every little detail, but since this is a big event I figured I should update the situation here.

GSVC sold 6 million shares at $15.00/share.  Gross proceeds were $90 million but since the gross spread (underwriting fee/sales load) was 7.49%, net proceeds to GSVC was $83.3 million.

So before the offering, there was 5.52 million GSVC shares outstanding and a NAV per share of $13.26.

Since the stock was offered at above NAV, this was *accretive* to NAV, which is good for current shareholders (but it is dilutive to new buyers who buy stock on the offering since they are paying *more* than NAV).

Let's see how this changes the structure at GSVC:

New shares outstanding:     11.5 million
New NAV:                            $156.5 million
New NAV/share:                  $13.61

So this deal increased the NAV from $73.2 million to $156.5 million, and NAV/share from $13.26 to $13.61. 

I use the September 2011 quarterend NAV of $13.26.  The registration statement included an unaudited estimated NAV/share as of the end of December 2011. This was a range of $12.80 - $12.95/share, but to be generous, in my analysis I will keep using the higher September 2011 NAV figure.

So the offering, at $15.00/share was at a 16% or so premium to the December-end estimate.

What does this mean for GSVC as a Facebook play?
As far as we know, they still own 350,000 shares of Facebook at a cost of around $30/share.   $30/share already values Facebook at $75 billion.  So if the IPO came off at $100 billion, that's a gain of $3.5 million for GSVC.  But now that NAV is $156.5 million, the impact on GSVC is obviously much smaller.  FB will go from being 14% of the portfolio to more like 7%.

Here is a table of what GSVC NAV/share would be depending on Facebook valuations (I use 2.5 billion shares outstanding for FB; I think I used 2.3 billion in my last post):

Facebook            Facebook                GSVC
value                   price/share              NAV/share                   %gain
$75 billion          $30                         $13.61  (current NAV)
$100 billion        $40                         $13.91                           +2.2%
$150 billion        $60                         $14.52                           +6.7%
$200 billion        $80                         $15.13                           +11.2%
$250 billion        $100                       $15.74                           +15.7%
$300 billion        $120                       $16.35                           +20.1%

So from the above, you can see that for every $50 billion increase in the valuation of Facebook, GSVC NAV/share only increases $0.61/share. 

So again, all else equal, a GSVC stock price of $15.00 is already discounting a $200 billion valuation for Facebook!  Might Facebook be worth much more?  Possibly.  But even with Facebook at $300 billion, GSVC NAV would only go up to $16.35/share, still far below where it has been trading recently.

GSVC may use the proceeds from this offering to buy more Facebook shares, of course, but at this point they will be paying much higher prices since the IPO is getting much closer.

The other point to keep in mind is that even if GSVC doesn't deploy this new capital right away, they will still charge the 2.0% base management fee.  Total annual expenses for GSVC is 3.4% or so.  I typically use a 10% discount rate to value things, so this, to me, would merit an almost immediate 34% *discount* to NAV unless management proves over time that they can increase NAV at better than the market.  But the starting point for me begins at a 34% discount and then I figure out where we can go from there.

In this case, there is a special situation called Facebook, and possibly Twitter.  But the above shows that at least for Facebook, the stock price way more than discounts a complete, out-of-the-ball-park, grand slam.

Will Twitter be as hot?  Will they find other 'hits'?  I really have no idea but I would prefer to play elsewhere.

By the way, this is not a shortable stock.  Of course I tried when it got over $20/share, but the short got rejected.     Oh well...    This is why markets can get inefficient sometimes.


Wednesday, February 8, 2012

Biglari Holdings: Real Deal or Phony?

Biglari Holdings (BH) is a Berkshire Hathaway like investment vehicle run by a young manager named Sardar Biglari.  Actually, BH is what was Steak 'n Shake (SNS), a hamburger restaurant chain that Biglari's hedge fund owned.   After a bunch of transactions which merged the hedge funds with Steak and Shake and another restaurant chain, Western Sizzlin, SNS was renamed BH (like the intials of Berkshire Hathaway).
Anyway, the details of these transactions are well documented so I won't repeat them here. 

This is certainly an interesting situation as Biglari is going in the direction of Berkshire Hathaway in that he wants to run this business taking the cash generated by the restaurant business and invest it wherever he sees fit.  Of course, this rubs some people the wrong way, but I don't think it's a bad idea at all.

Controversial
So anyway, Biglari has been talked about on the internet largely due to his similarity to Berkshire Hathaway.  Of course, this has caused a lot of the coverage to be negative.  His renaming of Steak and Shake to Biglari Holdings was seen as egotistical.  His annual reports, website and letter to shareholders have the same sort of look and feel as Berkshire Hathaway's etc...

Other actions that have been criticized are:
  • Did a 1/20 reverse split to get the stock price up into the hundreds (wanted a high price like BRK?)
  • Attempted another 1/15 reverse split to get stock price up from $400 to $7000 to artificially create a high stock price, (wanted a higher price just like Berkshire Hathaway?)
  • Proposing the issuance of Class B shares with 1/10 the economic value and 1/100th the voting power (just like Berkshire Hathaway's B-shares). (why go to the trouble of reverse splitting and then issuing low priced B-share?)
  • High compensation:  $900,000/year salary (versus $150,000 or so for Buffett) plus an incentive bonus plan very hedge-fund-like; 25% of the increase in book value over a 6% hurdle rate (this is capped, however, at $10 million)
  • Put a photo of himself in every SNS store (egotistical!?)
  • Drives fast cars
I think to many, Biglari comes across as a young, cocky, arrogant kid. 

Sure, some of this stuff is a little irksome, but I actually don't see anything 'wrong' with it.  Emulating Buffett and Berkshire is actually a good idea, I think.  Some feel that he is only emulating the look and feel to deceive investors into thinking he is the next Buffett.  Well, that may be so, but I tend to think the Berkshire fans are overreacting a little bit and feel offended that some young kid is copping stuff from their hero.

That's OK with me.   Leucadia's website looks just like Berkshire Hathaway's too.

As for the 'egregious' compensation, I think it might have been a bit tone-deaf to shoot for a hedge fund-like compensation structure but I don't see too much a problem with it as long as he performs.   There is a hurdle rate of 6%, so the book value has to increase 6% before he gets paid.  Plus the bonus is capped at $10 million. 

This pay is probably high for a business of this size, but again, if he does well I think it should be fine.  But then again, I am OK with the compensation at banks and investment banks which are way more ridiculous so I know my view won't be shared by most and that's OK.

There are some other issues out there with respect to past transactions, but I think that's more about upsetting some people but not anything illegal.

Anyway,  so there is a lot to be critical about with BH and there are plenty of negative comments on the internet.

But as I read them, for the most part, I see problems more with people just not liking Biglari and some of his methods.  But I don't see anything really glaring that is a big problem.  I actually think he is honestly trying to do well.

So setting aside all of these distractions, let's see how he is doing in the business.

Steak 'n Shake
So let's get down to business.

This is the trend in customer traffic in same-store sales at Steak & Shake from the 2009 BH annual report:

So when Biglari took over management of SNS, the fundamentals were horrible.  Customer traffic was down consistently as were same store sales.  You can't blame the economy for this horrible performance since the figures seem horrible from late 2005 (2006-2007 were boom years).

The bold figures show how SNS has done since Biglari took over.  There is a huge change.
And here is the same from the 2011 BH annual report that includes the figures for 2011:


So there is a very noticable improvement.  We know that Biglari has made a big positive change at SNS.

They just opened a new store concept on Broadway in NYC in January, which is called the Steak 'n Shake Signature, which is more like a fast food joint with counter service only and few tables.  The yelp reviews are mixed (as they always seem to be) but I've heard recenty from people outside NYC that they do like the Steak and Shake stores.

Yes, the burger market is crowded with everyone from McDonald's to the new age Five Guys, Shake Shack, In-and-Out and many others.

BH is going to manage the restaurants for their cash flows so will continue to invest as long as they can do so with good returns.  Otherwise, they will allocate capital to other areas.

I tend to like these kinds of models (LUK, L, MKL, BRK etc...).

So What is BH Worth?
So that's the real question.  I'm not really that interested in a hamburger joint, but am interested in what Biglari can do with it and where BH will invest capital in the future.  Right now, the next largest piece of BH is Cracker Barrel (CKBL), which BH owns 15% of and is trying to activist the stock back to health.   Maybe the CKBL drama will be another post for another day.

I do certainly agree with the likes of Biglari that a lot of businesses tend to get stuck in old ways of doing business even if it is no longer the right way to go.    So I am not at all opposed or bothered with Biglari's activism (so far from what I've seen). 

I think this is another thing that bothers BRK fans; Buffett is a passive investor and doesn't rock the boat (or at least he doesn't do that anymore... or he doens't do it publicly).

Anyway, looking at BH was a bit confusing.  First of all, I was disappointed when I searched around for a valuation of BH that most people just took the published financials and used them without any adjustments; people used the GAAP book-value per share, earnings and cash flows and just slapped on the usual multiples and made judgements based on that.

However, BH is a strange animal and the GAAP figures can be very misleading. 

For example, BH owns shares in a hedge fund that Biglari runs, but GAAP requires full consolidation of the partnership units even when a large part of it is owned by hedge fund investors and not BH.   That's fine.  This is an issue with private equity funds too and investment banks that have to consolidate holdings held in their private equity businesses.

But what makes it confusing for BH is that the hedge fund (The Lion Fund) owns a large stake in BH.  So BH owns a part of the Lion Fund, which owns a big stake in BH.  This is all consolidated, but since the Lion Fund owns shares in BH, the shares of BH held in the hedge fund are deducted from shareholders' equity as treasury shares (because by consolidating the hedge fund, they own shares in themselves).

This is all well and fine, but the problem is that the BH shares that the hedge fund owns is still outstanding as outside investors own a majority of the hedge fund.

The correct way to net out this BH holding in BH is to deduct from shareholders equity only the portion that is actually owned by BH, not the entire BH position owned by the hedge fund.

Confusing?

And since the BH shares are deducted from shareholders equity and is accounted for as treasury shares, they don't appear on the asset side of the balance sheet.

OK.  So don't worry about that too much.  I *think* I have it figured out.  I may be wrong.  But let's go on.

What's the Restaurant Business Worth?
In the year-ended September 2011, the restaurant business looked like this:

Revenues:                                   $705 million
Operating earnings:                      $42 million
Net earnings:                                $30 million

Depreciation and Amortization:  $28 million
Capex:                                          $11 million
Identifiable assets:                     $414 million
Goodwill:                                   $26.5 million

SNS did a dividend recap; they issued long term debt and paid a cash dividend to the parent company.

As far as I can tell, this debt, $112 million is owed by SNS but the interest expense doesn't seem to be included in the restaurant business segment breakdown above.  Segment operating income typically excludes interest on debt and the difference between operating earnings and net earnings in the above figures suggest that the interest on this debt goes below these lines.

So when valuing the restaurant business, we will just have to deduct the debt from the equity valuation.

What is a restaurant company worth these days?

Here is a quick table for restaurants and valuations:
                                          ttm              ttm                            Operating
                                          P/E             EV/EBITDA             margin
McDonald's                      19x             11.7x                         30.7%
Darden Restaurants          15.2x            8.4x                           9.1%
Yum Brands                      25.5x          12.5x                        15.9%
Brinker International        16.5x            7.7x                           8.2%
Bob Evans Farms             17.6x            6.2x                           6.7%
Cracker Barrel                  14.9x            7.7x                           6.9%
Ruby Tuesday                   16.9x            6.9x                          4.2%
Red Robin Gourmet          18x*             6.8x          

*Red Robin has been having problems so 18x is based on what they earned in the past.

So it looks like anywhere between 15-20x is normal for a restaurant business.  California Pizza Kitchen was taken private last year and their merger proxy had valuations for restaurants too, and out of their universe, the median p/e ratio was 16.5x p/e and EV/EBITDA ranged from 6-8x depending on the universe.

So let's say 16.0x p/e and 7x EV/EBITDA is fair for SNS.  That does not seem unreasonable at all given that even Red Robin is trading at 18x what they used to earn in good times and 7x last twelve months' EBITDA.

SNS earned $30 million in net last year, so 16x that is $480 million (I say SNS, but actually I mean the restaurant business; this includes Western Sizzlin, most of the restaurant business is SNS).  With $112 million of debt, that leaves an equity value of around $368 million.  Using a 7x EV/EBITDA figure, we get $70 million in EBITDA x 7x = $490 million less $112 million in debt gives us a $378 million value; very close to our p/e valuation.

So the first part of the valuation is the restaurnant business:

Restaurant business value:  $368 million  (use 16x p/e value)

So what else is there?  We know that BH owns shares in the hedge fund.  But a lot of that is invested in BH, let's not even include the non-BH assets owned by BH.

Then there are two big pieces left.  One is cash. and the other is investments:

Cash at September 2011:   $99 million
Investments:                       $115 million

It's important to remember that the "investments" don't include anything owned in the hedge fund, as those are in "Investments held by consolidated affiliated partnerships".

So the total valuation is the sum of the above three (in simple terms):  $368 mn + $99 mn + $115 mn = $582 million

The total value of BH is $582 million

How many shares do they have outstanding?  They have 1.5 million shares outstanding, but deducting as treasury shares the amount BH actually owns through the hedge fund give us 1.43 million shares outstanding. 

It's important to keep in mind that on the balance sheet, the number of shares outstanding shows 1.2 million shares outstanding after deducting 284,000 shares in treasury stock which is wrong.  This deducts the entire amount of BH shares owned in the consolidated hedge fund of which BH only owns a portion of.

So the total valuation is $407/share.

Keep in mind this is a simplified analysis.  BH owns a part of the hedge fund and there are assets other than BH in them.  BH also earns a management fee and incentive fees on the hedge fund.  I left all of this out and other smaller items as the above three, I think, look at the big value determinants of BH.

So with BH trading at $411/share, it looks about fairly valued using balance sheet data as of September 2011.

However, let's take it one more step as BH did announce earnings for the 12/2011 quarter.  We can update the above figures and come up with a more up-to-date value for BH.

Updated Value of BH

First of all, as of the end of December 2011, cash and investments have moved up to $234 million.  

The restaurant business is interesting, though.  In 2011, the operating margin for the restaurant business was around 6%, but in the December 2011 quarter, operating margins went up to 8.5%.   This makes sense as they continue to improve operations there.

If we assume, perhaps conservatively, that SNS grows sales 5% in the year to September 2012 (year-over-year sales in the December quarter was around +5%) and they achieve an operating margin for the year of 8.5%, they would get a nice boost in operating income.  

This might be conservative as they just launched the new model store, Steak 'n Shake Signature.

Anyway, so 5% growth from $705 million is $740 million.  And an 8.5% margin would give us operating earnings of $62.9 million.  Using the same tax rate as last year, net income would be around $45 million.

Going back to the above model of 16x p/e for the restaurant business which is not aggressive at all, I don't think, that's a value of $720 million.  Deduct the $112 million and you get $608 million equity value for the restaurant business.

So, with the current $234 million cash and investments on the balance sheet, and $608 million equity valuation on what the restaurant business can do this year, that's a total valuation of $842 million.

With 1.43 million shares outstanding, that's a value of $590/share, or 40% above current levels.

Is 8.5% operating margin achievable?  Biglari has said during 2011 that their earnings are subdued due to investments made for the future implying that the 6% operating margin for last year was not going to be normal.

Judging from how restaurants typically do, 8.5% operating margin does not at all look like a stretch.  Also, their new, smaller concept (Signature) and their moving forward on expanding franchising should be good for margins. 

(When Chipotle started rolling out their A-model stores, their margins seemed to explode; they were able to make smaller stores for cheaper, but generate simliar amount of traffic as their larger restaurants, which was good for operating margins and returns on capital.  Something simliar may happen with Steak and Shake if they can succeed in the Signature rollout. Also, franchise businesses tend to have higher margins and returns on capital for obvious reasons if done right).

Conclusion
So that's just a quick look at BH and I do find it interesting.  If they meet even modest goals I laid out above, this stock can easily move up to $500-600 range.

I have to say that this is a quick first look so I may be missing something.  I think the overall look is correct but as I follow this going forward, I may have to make some corrections.

Interestingly, this doesn't even take into account anything else that might happen there, including what happens with the $100+ plus cash on the balance sheet (I assume the restaurant debt will be paid back over time out of restaurant cash flows, so this current cash is deployable).

Also, further progress in the CBRL drama can give a boost too as it is a large holding in BH.  Of course, Biglari failed in his bid to get a board seat, but these things never end just like that.  The pressure is on at CBRL and sometimes that's all it takes to get operational improvements and other changes.  We'll see about that.

I understand that there is a lot of criticism against Biglari and there are things that bother me too.  But as long as he isn't doing something outright wrong, illegal or unethical, I don't really have a problem.  Aggressive tactics is all part of business. 

We shall see how this turns out.  Of course, like anything else, there is a lot that can go wrong here, so do your own homework! 


Friday, February 3, 2012

Gold Standard?

I already wrote about what I think about gold here and here and that's actually more than I want to say about it, but since there is more talk again about going back to the gold standard, I thought I'd make a couple of quick comments.

I actually don't care too much about this topic as I think a gold standard will never happen.  I think once people really think this through, they will realize that it is impossible to implement, and even if they did they will quickly realize that it won't work.

This "let's go back to the gold standard" argument is basically just a big protest against congress and the 'unelected' power of the Fed (and other central banks around the world). (As an aside, I find it interesting when congressmen criticize the unelectedness and unaccountability of the Fed as if we would be better off if congress controlled the printing presses and as if congress holds themselves accountable in any way for anything).

The argument, quite simply, is that congress and the Fed are out of control.  We need to control the process of money creation.  By linking money to gold, this will take away the Fed's power to create phony money (which leads to bubbles) and things will be O.K. 

So, the problem is basically the Fed.  And the answer is, abolish the Fed, tie the dollar to gold.  Simple.

As with so many things, these 'simple' solutions are rarely simple.  Early in the 20th century, I think, people found a way to get rid of white blood cells as they learned that this is the cause of pain.  Well, they got rid of the pain but then the patients died too.  Why?  Because the white blood cells were responsible for fighting infections; this is what caused the pain.  By eliminating the pain, they eliminated the patient (unintended consequence).  This story is just off the top of my head so I'm sure I got things wrong, but you get the point.

So let's look at some key points about the gold standard argument:

Inflation and out of control debt growth happened because we went off the gold standard
I find this argument to be backwards.  People point to 1972 and then the explosion in inflation after that and point to the delinking of gold from the dollar as the cause of this inflation.   My view (but I'm no economist) is that the U.S. had underlying inflation and debt growth that made the gold standard unsustainable.  This is why the U.S. had to get off the gold standard (or run out of gold, or plunge into a depression etc...).

The situation got to a point where it became unsustainable.  So for the first argument against going back to the gold standard, one answer is that we can try for a while but it won't last as it didn't last before.

You can control price or quantity but not both
A gold standard is quite simply a price control and as a free marketer, I tend to think price controls don't work.  Whether it's Nixon's WIN (whip inflation now) or currency fixing or Russian-style price control, it won't work.

If you control price, then you can't control quantity and vice versa. 

If we go back to a gold standard, then we will have no mechanism to smooth out economic fluctuations.  Many will argue that with a gold standard, we won't have the booms and busts that we've had in the past 30 years.

Wrong.

One of the biggest bubbles and bursts, even to date, is the 1929-1932 bubble and depression and as far as I recall, we were on a gold standard.  There were no derivatives.  There were no hedge funds.  There were no CDO's and CDO-squareds.  The booms and busts pre-Fed in the 1800s are far harsher than what we've seen in the 20th century since the Fed was created.  Depressions were deeper and lasted longer.

I don't know how the mechanics of a gold standard would work, but it may lead to a ban on owning gold.  This, again, I am hugely against.  I don't even like gold, but I dislike even more government control over asset ownership.  Restrict guns?  Yes, I can dig that.  But gold?  Nope.  That makes no sense.

If the economy takes a dip and the Fed can't create money, then we may very well enter a deep recession or depression.  That would create calls for devaluation of the dollar or the abandonment of the gold standard.  At that point, like in 1972, you will create huge disruption as the system that was built on it is shaken to the ground.

This is similar to what is going on in Europe right now; many economists say that Greece would not be in such a bind if they weren't tied to the Euro.  As a Euro member, they have no control over the value of their currency.  Now a debt restructuring is the only way for Greece to get out of it's bind.  So instead of a 50% depreciation in the currency over time (which is totally manageable as we have seen in the U.S. many times), they will have to cut government bond principle by 50%, basically overnight.  Many holders of these bonds were European banks that had zero capital set aside against them as they were presumably risk-free sovereigns.  And this is creating a bank crisis in Europe. So much for price fixing.

What if Greece was not linked to the Euro?  Banks would probably have had foreign exchange hedges against their Greek bond holdings so whatever problems they have wouldn't have been a 'shock' to the system.

This is the reason why Greece is in so much more of a bind than Japan, even though Japan has more debt; Japan can print their own currency, Greece can't.

Now if we go to the gold standard, things will look fine for a while, just like Greece looked fine for a while.  And just like Argentina looked fine for a while when they tied their currency to the U.S. dollar, and just like Asian countries looked fine for a while when they too had their currencies tied to the U.S. dollar (until the 1997 Asian crisis).

These 'fixed' prices are very misleading.  It makes things look good in the short run, but imbalances increase over time until it becomes unsustainable and blows up.  Just like gold prices/U.S. dollar in 1972, Asian currencies in 1997, Europe now etc...

All of these crisis events were preceded by a long period of 'calm' and stable prices/currencies.

If the price control is not working in Europe now (Greece etc...), I don't understand why people will think it will work here in the U.S.

Do we even have enough gold?
Again, I don't know what the mechanics would be of a new gold standard, but the dollar will have to be backed and convertible into gold to some extent for the link to be 'true'. 

So the question is, how much gold does the U.S. even own?   A quick look on the internet shows that we own around 8,134 tons of gold or 262 million ounces.  That sounds about right.  At $1,700/ounce, the U.S. owns $445 billion of gold.

How much debt does the U.S. government have outstanding?  $15 trillion.  Of that, foreign governments own $4.5 trillion.  China owns $1.2 trillion.

So what if China balks at the U.S. dollar, sells the treasuries for dollars and demands gold in exchange?  We don't have enough gold in this country to ship to China.

(By the way, people seem to think that a gold standard will also stabilize the balance of payments around the world.  But again, I think history disproves this.  I think what happens is that when someone starts to run out of gold, they start a war and steal gold from another country, or they just go off the gold standard (as has happened repeatedly in the past))

What would happen to the U.S. dollar if we went on the gold standard?
The other thing that I don't think gold standard fans really think about is what would happen to the U.S. dollar if we went on the gold standard.  Imagine if the dollar was backed by gold back in 2000.  When the dollar rises even 10% against other currencies, people complain about the U.S. becoming uncompetitive globally.

What will happen if the U.S. went on a gold standard?  Would the dollar not appreciate at an incredible rate? 

There is a case study, and that is Switzerland.  I think they were the last to go off the gold standard and that was because their currency became too strong, threatening their domestic industry (which depended on exports).

What would happen to what little U.S. manufacturing we have left?  Would exporters be happy with such a situation?

So then we have to all go on the the gold standard together around the world.  We have a case study in that too: Bretton Woods.  How did that work out?  The Japanese yen was fixed at 360 yen/dollar for decades until the Bretton Woods fixed exchange rate system collapsed.

Again, some claim the world went nuts because we abandoned Bretton Woods.  But my view is that we didn't abandon it because we wanted the world to go nuts, but we abandoned it because it became unsustainable.  Massive changes in economies around the world made these 'fixed' rates totally unrealistic and unreflective of reality.  (This kind of reminds me of China now; they are still fixed to the U.S. dollar, but many suspect that changes in the Chinese economy over the years make this current fixed rate completely unreflective of reality. Which leads to the question, who should then set and reset exchange rates over the years to adjust for these changes in economies?  A currency board?  The IMF?  Not.  I would advocate letting the markets decide, in real time, 24-hours a day.  And same with gold prices).

This is what would happen too, again, if the world went on a global gold standard.

You can point back to the Euro as exhibit A in this example too.  Fixing exchange rates, taking away the ability for some to control the quantity of money etc... won't work.  It just creates other imbalances that sooner or later makes the 'fix' unsustainable and it blows up with a louder sound than if you allow market forces to send signals so that people can react to problems over time, instead of overnight.

So,
  • Gold standard won't work because it's a price control.  Price controls don't work.
  • Gold standard may require limitations on individual ownership of gold; I am against this sort of government control over harmless assets
  • We didn't go off the gold standard to mess up the world, we went off the gold standard because it was unsustainable (due to our irresponsible behavior, which proves that a gold standard will not prevent that)
  • If we went back to the gold standard, it will be unsustainable just like all other price fixes proved to be unsustainable in history (Bretton Woods, gold standard, Euro, Asian currency link to U.S. dollar, Argentina currency link to U.S. dollar and currency board)
  • If we behaved, the gold standard might work.  But if we behaved, we don't need a gold standard.  If we have a gold standard and misbehave, we will just have another 1972 at some point in the future.

Anyway, I am not an economist or commodity/gold specialist. These are just my thoughts on the subject. And yes, I know there are many, many people way smarter than me calling for a gold standard so many will disagree with the above.  But again, these are just my thoughts and observations on the subject.


Thursday, February 2, 2012

So What is Facebook Actually Worth?

So like everyone else in the financial world (OK, maybe not) I went through the Facebook S-1.  I don't normally look at these internet/technology businesses especially when it is really hyped and there is no chance that this thing will come out undervalued.

But I do think Facebook is an exceptional company so I decided to take a look.  They truly are onto something and this is way more interesting to me than other recent offerings such as Zynga, Groupon or LinkedIn.   That doesn't change, however, the fact that this stock when listed will probably not be a good buy.

Anyway, again, like everyone else in the blogosphere I will take a shot at valuing this thing (even though we know that that is hard to do!).
First of all, the price talk on the IPO is a valuation of $75 - 100 billion.    We now know from the S-1 that sales was $3.7 billion, operating income was $1.76 billion and net income was $1.00 billion in the full year ended December 2011.   So on those figures, the valuation of the stock at $100 billion is 27x revenues and 100x p/e.

That is pretty expensive, but not too bad given these internet business IPO's.  Also, we looked at AMZN recently and that's trading at 100x p/e without anywhere near the profitability of Facebook (FB).  AMZN has razor-thin margins while FB has an operating margin of close to 50% and a net margin of close to 30%.

So on that alone, one can argue that FB is completely reasonable at 100x p/e.  Why not?

OK, that doesn't mean I would be interested in FB at 100x p/e, though.  I am just observing that the market can support such a valuation.

Some Basic Figures
Anyway, FB is all over the place so I won't jot down all the details, but here are some basic facts about Facebook:
  • 845 million monthly average users (+39% yoy)
  • 483 million daily average users (+48% yoy)
  • 2.7 billion likes and comments per day
  • 250 million photos uploaded per day
  • 100 billion friendships
  • 3,200 total employees

Industry Data
This is some data from the S-1 that I will jot down for future reference:
  • 2010 worldwide advertising spending was $588 billion
  • Traditional offline brand advertising (TV, print, radio) was $363 billion (62%)
  • Worldwide online advertising spending is projected to grow from $68 billion in 2010 to $120 billion in 2015 (12% of total advertising -> 16% in 2015)


So What is Facebook Worth?
OK, so let's get down to the most important thing.  People seem to be focused on who has how many shares and how many billionaires will come out of this, how much in salary the CEO makes, what he is worth and all that.  

But that stuff is not really all that relevant.  Neither are historic valuations of FB.  FB includes some fair value analysis to value the RSU (restricted stock units), but they lean hard on the market transaction based approach to valuation so they just use the secondary market traded price (in the December 2011 quarter, they used $29.73/share as the fair value of FB's class B shares).

That's not new information because we already knew the prices realized on the private secondary market.

Price-to-sales and p/e ratios on 2011 results are fine too, but this totally depends on growth rates.  How do you project future growth rates for FB? 


End of Superhigh Growth Rates?
So the year-over-year growth in monthly average users has come down to more normal levels as seen below.  Growth rate was +500% in 2004, down to 100% in 2006, up to 150% in 2008 and then trending down to +40% last year.


Market Potential
So let's look at how much each monthly average user generates in revenues and profits for FB.  This isn't so hard as the data is all there in the S-1.

Below is the trend in monthly average users and revenues.  Since the growth in MAUs were so high, I used the average MAU per year to calculate the revenues per MAU.  For the average MAU for the year, I just added the end of year figure to the end of year figure for the previous year and divided by two. 

From this, we see that MAU generates revenues of around $3.50/MAU.  This includes the low figures in 2004 and 2005 which is arguably the upstart stage so may not be good data points.  Since 2006, revenues per MAU has ranged in the $3.00 - $5.00 area.

We can be generous and use the high end, say, $5.00/MAU in revenues.

Let's cross check this with more recent quarterly figures. Quarterly MAUs and revenues are also included in the S-1 and here is the data:


From this, it seems that the average revenues/MAU is stable in the range of $3.00-5.00 range, or closer to $5.00/MAU in the most recent year.   So $5.00/MAU seems to be a reasonable figure to use.

What is the profitability of this revenue?

For the years 2009 - 2011, profit margins were:

                                          2009        2010           2011
Operating margin              34%         52%            47%     
Net margin                        29%         31%            27%

So it seems the profit margins are pretty stable at 50% or so on the operating margin and 30% or so net margin.   So let's use that for our valuation.

FB said that there are more than 2 billion internet uses in the world.  So let's say that FB succeeds in signing up as users every single internet-connected person on the planet.  That would take MAU up to 2 billion.

So FB makes $5.00/MAU, so that's a revenue of $10 billion per year and with a net margin of 30%, that's a net income of $3 billion.  At a $100 billion valuation, FB is trading at 10x revenues and 33x net income.

So even if FB achieves 100% penetration of all internet users on the planet, (at which point the projected revenue and profit growth at FB would be a lot lower), FB would still be valued at 33x P/E.  Cheap?  I don't think so.

OK, so let's take this a bit further.  FB says that in the U.S. (and Canada), they have a 60% penetration rate of internet users.  Internet usage in the U.S. is around 80%.    The MAU in the U.S. and Canada is 179 million and the total population of U.S. and Canada is 347 million.

So the FB penetration of the population is around 50%.  This makes sense:  80% internet connection rate and 60% FB penetration rate = 48% or so.

From here we can take a big leap and assume that FB reaches the entire global population to the same extent it reaches the U.S. population (which is of course impossible given the low internet penetration rate today globally compared to the U.S. and other factors that will prevent FB from reaching as many users elsewhere than in the U.S.).

There are 6.8 billion people in the world today, and with a 50% penetration (FB reaches half the global population), that's 3.4 billion MAUs.

At $5.00/MAU, that's potential revenue of $17 billion.  With a 30% net margin, that's $5 billion in net earnings potential.  At a $100 billion valuation, FB is still trading at 5.9x revenues and 20x potential earnings!   That's with FB conquering the whole entire world!

For reference, below is the table of internet usage globally:


For reference, FB says that their internet user penetration rates are as follows:
  • more than 80% in Chile, Turkey and Venezuela
  • 60% in the U.S. and U.K.
  • 20-30% in Brazil and Germany
  • Less than 15% in Japan, S. Korea, Russia
  • 0% in China
These higher penetration rates may be special cases as growth rates in the U.S. is already slowing with the penetration at 60% or so.  In any case, the above analysis already includes the assumption of penetrating *all* internet users in one case, and the entire global population (at 50% total penetration which is the same rate as U.S./Canada).

Conclusion
Like Amazon, I love Facebook and think it's a really great way to find friends and keep up with them.  I use it all the time.  But from the above analysis, it seems that FB is trading at 33x P/E ratio even if they penetrate every single internet connected user today (which is not a forgone conclusion) and at 20x P/E ratio even if they conquered the whole entire world today (which is impossible in the near future, of course).

This seems to suggest that the market at $100 billion valuation is pricing in *all* potential for FB, at least based on the current business model.

Does this mean that FB is a short?  No.  FB seems to be so hot that I wouldn't be surprised if it rallied for quite a bit even after getting listed at $100 billion or more.  The user base would certainly be potential investors and can take the stock price way up over rational valuation.  Shorting something like this is a good way to get steamrolled.

Also, keep in mind that the above analysis doesn't take into account things FB can do to increase revenues per MAU, new businesses, possible acquisitions etc.

The above maximum potential valuation only considers what FB is doing now and increasing revenues and profits solely by increasing MAUs.

I remember during the internet bubble; many analyzed Amazon and said that the stock price more than discounts Amazon's winning of the entire book and CD market.  The stock price was overvalued even if you assume Amazon takes 100% of those markets.   The flaw with that analysis is that Amazon went global, and went beyond books and CDs.

This is certainly possible with FB.  FB may expand into media and other areas.  They have created a great platform with a huge population of users.  There is probably a lot of potential to generate revenues from this.

However, Yahoo too has a lot of users but has failed to monetize much of their traffic so it doesn't mean the FB can easily increase revenues per MAU. 

The above analysis is by no means the final analysis.  It's just one way to look at this stock with what we know now, a sort of sanity check.


Wednesday, February 1, 2012

Is Amazon a Short?


I hate to post a short idea on a day when the stock is down almost 10%; it's a bad time to sell or short something down a lot on short term news (earnings announcement).

But this is something I haven't looked at in a while so I decided to take a look (I actually started to look at this before the earnings announcement), and my opinion actually has very little to do with the results announced yesterday.

Anyway, what prompted me to look at this is that it is trading at what looks like 100x p/e ratio, which is very high.   Of course, shorting high p/e stocks in general is not always a winning strategy so this is not something I would typically look at.

But in this case, it looks a little interesting to dig a little.  I think part of the exuberance here is the halo effect from the iPad and Apple's success; the market may be reading that Amazon can grab some of the share and profits from Apple with the Kindle Fire.  

This may be true.  Maybe Amazon takes some share from Apple and maybe the Kindle is a game changer and iPad killer (Even though the Kindle may be great, I don't think it's in the same market as the iPad, actually).

Before I go on, I should say that I am a huge fan of Amazon.  I have watched them grow over the years and really think Jeff Bezos is doing an amazing thing.  He reminds me of Costco's Sinegal, where he really wants to treat the customers right and go for the long term loyalty of customers over short term profits.  Bezos, like Sinegal, seems to be looking really long term.

One of my favorite things is the customer reviews where Amazon doesn't edit bad reviews.  Of course, this upset suppliers early on but Bezos took the side of the customer and allowed it.  This may have seemed short term bad, but it turned out to be a long term good as it enhanced the trust of Amazon.  (I once tried to post a highly negative review of a Dell product on the Dell website, but the review never was posted!  Not so unpredictably, reviews were mostly 5 stars.  I tried to post my 1 star review many, many times and it never got posted).

 In a recent Wired magazine interview, Bezos also said that he would rather have low margins and a lot of customers rather than vice-versa.  Again, this is like an online version of Costco.

P/E Ratio
OK, so let's first look at the p/e ratio.  Amazon just announced the 2011 full year EPS and it came in at $1.37. The stock is trading at $176/share as I type, so that's 128x p/e ratio.  But wait, maybe earnings were hit this year due to forward looking investments.  So let's look at the peak EPS in 2010 of $2.53.  Against that, the stock is trading at 70x p/e.

For the current year ending December 2012, analysts estimate an EPS of $1.83, so against that, AMZN is now trading at 96x p/e.  Not cheap at all.  Looking forward, analysts estimate an EPS of $3.38 for the full year ending December 2013 for a forward p/e of 52x.  Still pretty expensive, especially given the forward estimate (not a sure thing).

Free Cash Flow per Share
We all know that p/e ratio is not the be-all, end-all of stock valuation.  Bezos from early on has insisted that it's not earnings that's important, but free cash flow per share that they will try to optimize over time.

Great.  So then let's look at that.  Forget about, for a moment, the many reservations I have about AMZN's free cash flow calcuation.  First of all, it doesn't take into account stock-based compensation expense, which I actually think is a real expense.  Adding it back underestimates cost.  Second of all, since AMZN's free cash flow is simply cash flow from operations minus capital investment, it includes changes in working capital.  When sales are growing, an increase in accounts payable can significantly increase cash flows (as they receive payments from customers before they pay their suppliers).  However, this increase in accounts payable is not sustainable in a steady state situation; it only grows as sales grows.  So looking at that and putting a multiple on it is like capitalizing a growth.

A more sustainable, stable free cash flow calculation would be something like net earnings plus depreciation, amortization and some other non-cash expenses less capex.

But anyway, let's give AMZN the benefit of the doubt and look at their free cash flow and free cash flow per share.

Here is a table summarizing some key figures from their 10-k's:


So from this, we can see that in 2009 they hit a peak free cash flow per share figure of $6.61.  So AMZN is trading at 27x peak free cash flow per share; not cheap.  In the last couple of years, they had free cash per share of around $5.00, so AMZN is trading at 35x free cash flow over the past couple of years.  Again, not cheap.

Yes, yes.  AMZN is still growing rapidly and these free cash flow figures will grow over time.  Maybe they had upfront investment for future growth that will pay off in the future.  It is also not clear what the Kindle is costing and how that impacts recent year figures as it is suspected that AMZN is selling them at or below cost to increase market share.

The other figure that AMZN stresses is return on invested capital.  AMZN defines that as free cash flow (as defined above) divided by invested capital which is total assets minus current liabilities (excluding current portion of long term debt). 

The ROIC figure in the table above shows that figure.   This shows that ROIC was pretty good but is trending down from a high of 45% in 2009 to 20% in 2011.

Again, it is not clear why that is and how the Kindle and other new business initiatives may be affecting this over the short term (for presumed returns in the future).


This is how the margins break out:

It seems that the operating margin for AMZN peaked out at 6.4% or so back in 2004.  This is understandable as they have been investing heavily and is entering new businesses which may have high upfront cost before future payoff.  Also, their increasing sales in areas outside of books and CD's may be negatively impacting margins.  It's not hard to imagine that sales in electronics and other general merchandise may not have the margins of books and CDs.  More on that later.

Also, look at the free cash flow margin.  This excludes stock compensation and includes growth in working capital, so again, I am a bit weary of slapping a multiple on that, but again, let's give them the benefit of the doubt. 

Since the margins oscillate based, I suppose, on where they are in investing for the future and the payoff, let's look at the average margins over the past few years.   I will only look at the profitable years. 

Since 2002, the operating margins averaged 4.1% and free cash flow margins averaged 6.6%.  OK, so the 2009 11.9% free cash flow margin looks a little suspect; I usually exclude spikey figures like that as aberrations.  But let's just leave it there for now.

Valuation of AMZN Based on Average Margins
So sales was up to $48 billion in 2011.  Let's assume they achieved average margins.  What would've been the EPS?  Average operating margin was 4.1%, so operating income would have been around $1.97 billion.  Other income in 2011 was $76 million, so add that for a total pretax income of $2.05 billion (I ignore net interest expense which is flattish).   Using the 31% tax rate for 2011, that's a net income of $1.41 billion, and with 461 million shares outstanding, that's an EPS of around $3.00/share.

At $176/share, AMZN is still trading at a lofty 60x p/e.

Free cash flow margins averaged 6.6%, so doing the above analysis would give us free cash flow of $3.2 billion, or $6.9/share, giving AMZN a valuation of 25x free cash flow.  Not cheap.

So from this, we can conclude that even if we adjust for short term margin effects, AMZN is not cheap.  Sales are growing strongly, though, so the question is if and when the margins start to improve.

There have been criticism that AMZN is just buying volume and building unprofitable business.  Let's take a look at some of the cost factors.

Why are Margins Declining?
One thing that people mention alot is that AMZN is increasingly depending on sales of electronics and other general merchandise, and less on books and CD's.   For example, sales of eletronics and general merchandise (EGM) grew +56% last year versus growth of +19% for the media business, and sales of EGM is now much larger than media (books, CDs etc...).

Let's see how the sales break down:


We can see how much EGM has grown in the past.  Almost 70% of the growth in the past five years has come from EGM. 

So where is this hurting margins?  Do EGM products have lower gross margins?  The following table breaks out some of the costs:

Gross margins are down a little but, but not really that much.  What is interesting is that fullfillment costs have gone up to 9.5% of sales recently, and marketing cost too has risen to 3.4%. This suggests that AMZN is indeed buying volume through marketing, which is not at all bad, of course, if they can make it back over time.  Fullfillment cost expense may have some temporary items but I don't know (they did say the Thailand flooding had an impact on the EGM business, but didn't mention anything specifically about cost, I don't think).  Otherwise it seems to have been stable at 8.5-8.8% or so.  (I will have to take another look; maybe I missed some one time factor in 2011).

But it looks like technology and content cost has been trending up too.  So even if some of these things are one time factors, it seems across the board.

The big thing, though, is the claim that AMZN is buying market share and volume with free shipping, Amazon Prime and things like that.

Below is the table of shipping revenues (shipping fees charged to customers) and shipping expense (what AMZN pays to deliver products to customers).

This table is really interesting:

 So it seems that there is truth to AMZN's buying of market share via free shipping.  Shipping fees charged to customers have trended down from 7.1% in 2003 down to 3.2% in 2011 while the expense shouldered by AMZN has declined only slightly from 9.7% to 8.3% in 2011.  This has lead to a net increase in shipping costs to AMZN from 2.6% in 2003 to 5.1% in 2011.  These figures are as a percentage of revenues.

This is big, since operating margins have only averaged 4.1% since 2003.   Net shipping costs have increased 2.5% since 2003, so that alone may account for a large part of the decline in operating margins.

Conclusion
So what do we have?  We have increasing sales, but with declining margins, increasing net shipping and other costs.  Will AMZN be able to keep increasing sales and market share without increasing incentives like subsidized shipping? I don't know.  AMZN is betting that customer loyalty due to these incentives will allow them to make back profits later. 

Will AMZN be able to increase margins back up without reducing these incentives? 

I suspect that with the Kindle, more and more of the fullfillment centers will be dealing with eletronics and other general merchandise instead of books and CDs, which will eventually migrate to the Kindle and other electronic distribution.

At that point, will AMZN still have a moat?  (AMZN's moat was it's incredible distribution centers for books/CD's.  If this migrates to eletronic distribution, will this reduce their moat?).

Even if AMZN is successful with their online TV and movie distribution, how much value will that add to AMZN?  The entire market capitalization of Netflix is less than $7 billion.  So even if AMZN succeeded in taking ALL of NFLX's business, that implies an additional $7 billion in value to AMZN.   With a current market cap of $80 billion, that adds less than 10% to the value of AMZN.

So as electronics and general merchandise increasingly become a bigger part of AMZN's physical distribution business, can they do it as efficiently as they have done books? I have my doubts about that.

I still like AMZN, the company, and am a big fan of Jeff Bezos but at this valuation in front of what seems to be such major changes in the company going forward, unfortunately, I would have to say I am more comfortable being short this thing rather than long.