There are all sorts of reasons why the market will be flat for the next decade or more and tons of reasons why the market will go down a lot from here. There are a lot of problems in this world for sure; read the newspaper on any given day and you would have to be nuts to own any stock at all. I know.
That's fine. Fear in the market is a good thing; it's the opposite of 2000 and 2006 when there was no fear in the market. I am more comfortable and happy today than either of those periods.
Stock market valuations seem reasonable to me, even though I'm not even too sure about what the correct valuation of the S&P 500 index is. It really doesn't matter to me as I don't own the S&P 500 index, but I own individual stocks. If I like the valuation of the individual stocks, I don't care what the valuation of the S&P 500 index is.
But still, I think about it and I pay attention to what people have to say about it.
One thing I keep hearing these days is that since corporate profit margins are at record levels today, they have to go down. It is unsustainable up here so when people say that the S&P 500 index is trading at 11x p/e or 12x p/e, they say that's incorrect due to the unnaturally high profit margins. When profit margins come back down to more normal levels, then the p/e ratios would look much higher than that.
That sounds interesting, and it is a valid argument in a sense.
But the problem I had with this is that as for the stocks that I've been looking at and that many value investors say are cheap, I don't see an abnormally high profit margin at all.
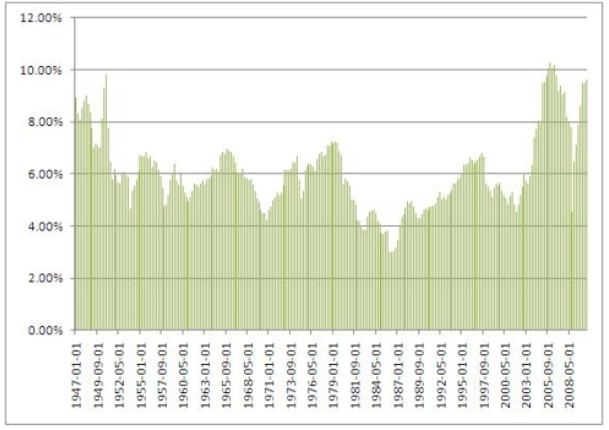
Anyway, first, let's look at what the bears are talking about:
Below are charts I cut and pasted from the internet that show corporate profit margins. I think the top chart is corporate profits as a percentage of GDP in the U.S.

The lower chart is corporate profits as a percentage of industrial output calculated by the Commerce Department.
Both charts show the same picture; corporate profits indeed look way out of whack with the economy. Profit margins, if this chart is accurate, does really look unsustainable.
In the early 2000s, the profit margin seemed to be well within historical range.
So out of curiousity, I jotted down the operating margins of some of the favorite value stocks and high quality blue chips since 2001 to see what the margins trends were.
Here are the results of that:
Operating Margins History of Large U.S. Corporations: 2001 - 2010

I just picked these names off the top of my head so I didn't cherry pick names to support my case.
A quick look here shows that operating margin trends have been pretty stable over time. I don't think there is any reason why these companies should suffer a decease in operating margin; they don't look spikey high and unsustainable to me.
I thought that maybe energy companies would have abnormally high earnings and margins now but Exxon Mobil (XOM) shows pretty stable margins over the past decade despite high crude oil prices. In fact, operating margins in the past couple of years look lower than in most of the past decade.
McDonald's, IBM and Disney all have seen higher margins over time, but these seem more like company level specifics; IBM moving out of hardware and more into software and services, McDonald's restructuring to refocus on the main business and eliminating distractions (Chipotle, Pret-a-Manger etc...) and adding new products like McCafe etc...
Big, high quality blue chips like Coca-Cola (KO), Proctor and Gamble (PG), Johnson and Johnson (JNJ), Kraft (KFT) have very stable margins throughout the past decade. No bloated margins there. Even the mega-giant Walmart (WMT) has very stable margins over time.
So where is this excess margin? I don't have a data-base to figure that out.
I think one factor might be globalization. Since big blue chips have been globalizing for a long time, many of them are starting to generate large profits overseas. These profits wouldn't show up in margin trends on a company basis because there would be global revenues to go along with the profits.
However, in a macro calculation like the above charts, profits earned overseas would be compared to U.S. domestic GDP, which leads to a problem of comparing apples to oranges.
Conclusion
Anyway, there are a lot of reasons to worry about the stock market, but I'm less concerned about this 'abnormally high margin' argument. First of all, I think globalization and other factors distort the numbers in the above chart where domestic company earnings are compared to domestic GDP (which completely ignores overseas revenues). This would make companies look like they are taking more share of U.S. GDP than in the past when in fact they might just be taking the same share of some other GDP around the world.
Even if that is wrong, it still shouldn't concern people looking at individual companies. Who cares if some macro chart shows excessive, spike-high margins if the companies you own don't. This is the problem with these 'big picture' stories, sometimes.
For example, some people were worried about the stock market (correctly) back in 1999/2000 when the p/e ratio of the market went up to 30x or 40x. That obviously should be a concern to people who owned the S&P 500 index, but if you owned a stock trading at 10-12x p/e ratio, then there was no reason to sell that. And in fact, many value investors did just fine in the years after that due to the presence of a lot of cheap stocks even in the late 90s. The stock market went down by 50% after that, but what went down the most were the very expensive stocks.
This may be similar, but I'm not even sure what the above charts tell us about the S&P 500 index because as my table shows, most large blue chips stocks don't seem to have unsustainably high margins and aren't trading at high valuation levels.
This is not to say that the market will go up or down. I just wanted to point out something interesting because of the large number of comments I hear that U.S. corporate profit margins *have* to come down. My quick analysis shows that maybe it doesn't have to necessarily, and certainly not for many of the high quality, blue chips.
So the above charts may be charts you don't have to worry too much about.
No comments:
Post a Comment
Note: Only a member of this blog may post a comment.